Review: nVidia GeForce GTX 660 & SLI
Category : NVIDIA
Published by Christian Ney on 13.09.12

Another NDA in the history of NVIDIA graphics cards has passed and once more we had the opportunity to test the card thoroughly weeks prior to the actual launch. We're talking about the GTX 660 of course which is based on NVIDIAs latest GK106 chip. In this article we're not only showing you the performance of one card we also analyzed it's performance in SLI.
On the following pages we will show you the
performances of the nVidia GeForce GTX 660.
Discuss this article in the
forums
[pagebreak]
Technical data / specifications
With the
nVidia GeForce GTX 660 you get a graphics card priced just under the 190 Euros
range (without VAT) that should be fast enough to provide best gaming experience. The manufacturer
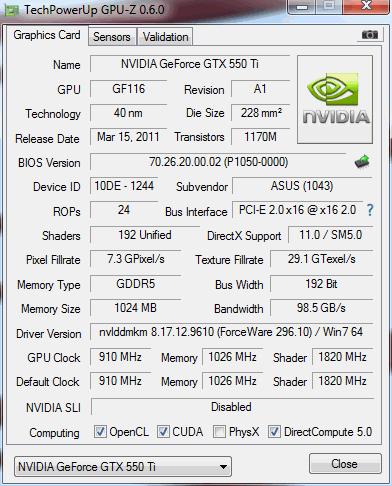
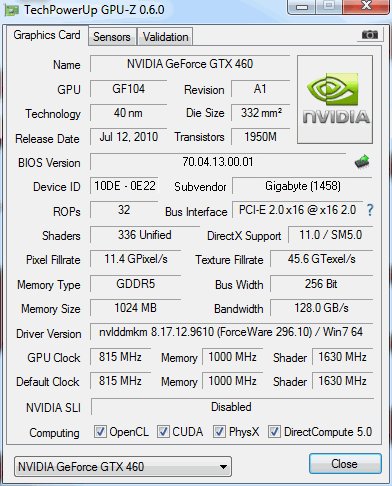
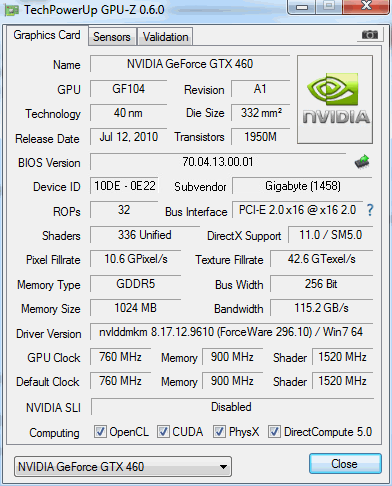
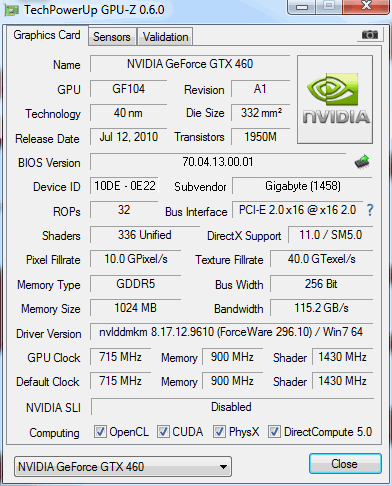
claims that the fresh new GTX 660 is up to 60 % faster than Fermi's GTX 460
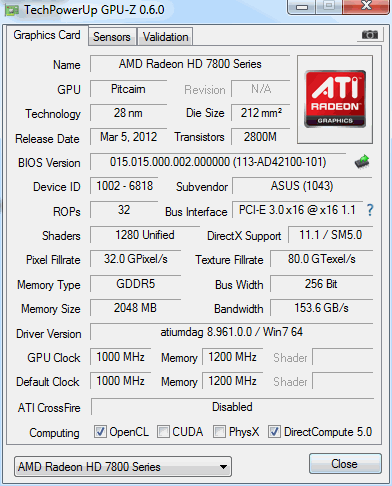
and 16 % faster than AMD's HD 7850.
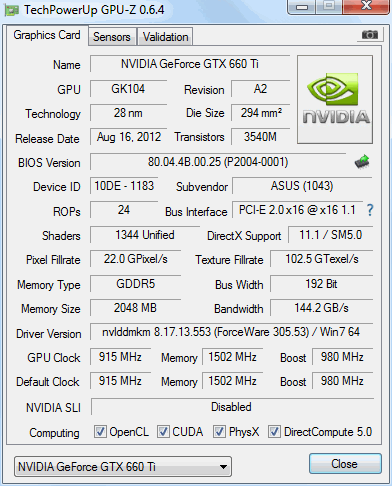
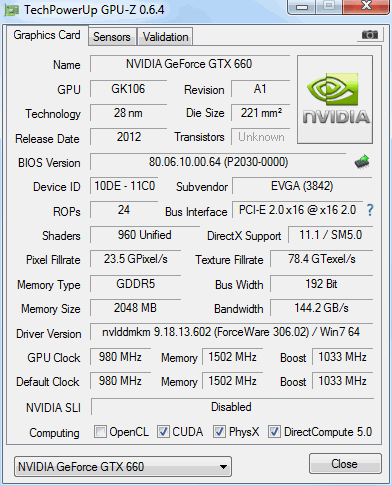
Looking at clock speeds we see that the GPU runs at 980 MHz standard with a
typical boost clock of 1'033 MHz. For the record the Boost Clock speed is based on the average GeForce GTX 660 card running a wide variety of games and applications. Note that the actual Boost clock will vary from game-to-game depending on actual system conditions
with a 13 MHz step.
The memory subsystem of the GeForce GTX 660 consists of three 64-bit memory
controllers (192-bit) with 2GB of GDDR5 memory clocked at 1'502 MHz (rated 6'008
MHz, americans like big numbers you know). While the memory clock speed and
memory technology/amount stay the same as with the GK104 based
graphics cards, the memory interface is different. Instead of a 256 Bit
interface (GTX
680/670) you'll find a 192 Bit interface (GTX 660 Ti/660). This also reduces the
available memory bandwidth from
192'400 MB/s to 144'000 MB/s.
The GK106 GPU itself consists of 2.54 billion transistors, 1 billion less
than the GK104. Then you find 960 CUDA cores aka 5 SMX units, 80 texture units
and 24 ROPs. We compared it to the GTX 670 and GTX 660 Ti in the table below.
About the power consumption, here is what nVidia says:
Under load, the GeForce GTX 660 typically draws up to 115W of power in most non-TDP apps. This is what you’ll experience with the power target slider set at its default 100% setting. If you wish to overclock the GeForce GTX 660, we highly recommend that you max the slider out at +110%. At this setting, the board will draw up to 127W in non-TDP
apps.
| |
GeForce GTX 670 |
GeForce GTX 660 Ti |
GeForce GTX 660 |
| Chip |
GK104 |
GK104 |
GK106 |
|
Process |
28 nm |
28 nm |
28 nm |
|
Transistors |
3.54
billion |
3.54
billion |
2.54
billion |
| GPU
clock |
915 MHz (Boost 980 MHz) |
915 MHz (Boost 980 MHz) |
980 MHz (Boost 1'033 MHz) |
|
Memory |
2'048 MB GDDR5 |
2'048 MB GDDR5 |
2'048 MB GDDR5 |
| Memory
clock |
6'000 MHz |
6'000 MHz |
6'000 MHz |
| Memory
interface |
256 Bit |
192 Bit |
192 Bit |
| Memory
bandwidth |
192'400 MB/s |
144'000 MB/s |
144'000 MB/s |
| TMUs |
112 |
112 |
80 |
| TAUs |
-- |
-- |
-- |
| Shader Cores |
1'344 (5D) |
1'344 (5D) |
960 (5D) |
| ROPs |
32 ROP |
24 ROP |
24 ROP |
| Shader
model |
SM 5 |
SM 5 |
SM 5 |
| Maximum board power |
170 Watt |
150 Watt |
140 Watt |
Discuss this article in the
forums
[pagebreak]
Test Setup
Hardware
| Mainboard |
- ASUS P8P67 Pro (BIOS 2303)
|
| CPUs |
- Intel Core i7-2600K @ 3.4 GHz (Turbo Off / HT On)
|
| Memory |
- G.Skill RipjawsZ Dual Channel 4x4GB CL9-9-9-24-DDR3-1600 MHz
|
| Graphic
Cards (Driver) |
- nVidia GeForce GTX 680
SLI (ForceWare 301.24)


- ASUS GeForce GTX 680 DCU II Top 1'201
MHz (ForceWare 301.24)

- eVGA GeForce GTX 680 SC SuperClocked
(Turbo up to 1'215 MHz) (ForceWare 301.24)
- nVidia GeForce GTX 680 (ForceWare
301.10)
- nVidia GeForce GTX 680 1 GHz (ForceWare
301.25)
- nVidia GeForce GTX 680 Boost Max 1'059
MHz (ForceWare 301.25)
- ASUS GeForce GTX 670 DCU II Top (TDP
117 %) (ForceWare 301.25)
- ASUS GeForce GTX 670 DCU II Top (ForceWare
301.25)
- nVidia GeForce GTX 670 1 GHz (ForceWare
301.25)
- nVidia GeForce GTX 670 (ForceWare
301.25)
- nVidia GeForce GTX 670 Boost Max 980
MHz (ForceWare 301.25)
- ASUS GeForce GTX 660 Ti DCU II Top
(Turbo up to 1'176 MHz) (ForceWare 303.53)
- nVidia GeForce GTX 660 Ti Boost Max 980
MHz (ForceWare 303.53)
- ASUS GeForce
GTX 660 DCU II Top (Turbo up to 1'163 MHz) (ForceWare 306.02)
- EVGA GeForce
GTX 660 SC SuperClocked (Turbo up to 1'150 MHz) (ForceWare 306.02)
- nVidia GeForce
GTX 660 Boost Max 1'033 MHz (ForceWare 306.02)
- nVidia GeForce GTX 660 Boost Max 1'033 MHz SLI (ForceWare 306.02)
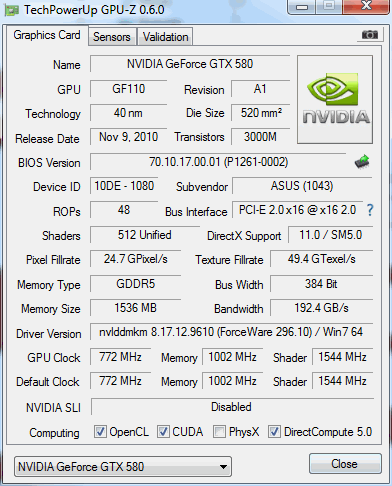
- ASUS GeForce GTX 580
SLI (ForceWare 296.10)
- MSI GeForce GTX 580 Lightning (ForceWare
296.10)
- ASUS GeForce GTX 580 Matrix Platinum (ForceWare
296.10)
- ASUS GeForce GTX 580 (ForceWare 296.10)
- nVidia GeForce GTX 580 (ForceWare
296.10)
- ASUS GeForce GTX 570 DCU II (ForceWare
296.10)
- nVidia GeForce GTX 570 (ForceWare
296.10)
- ASUS GeForce GTX 560 Ti 448 Cores DCU
II (ForceWare 296.10)
- ASUS GeForce GTX 560 Ti DCU II Top 1GD5
(ForceWare 296.10)
- ASUS GeForce GTX 560 Ti DCU II 1GD5 (ForceWare
296.10)
- nVidia GeForce GTX 560 Ti 1GB (ForceWare
296.10)
- ASUS GeForce Ultimate GTX 550 Ti DCU (ForceWare
296.10)
- ASUS GeForce GTX 550 Ti DCU Top (ForceWare
296.10)
- ASUS GeForce GTX 550 Ti DCU (ForceWare
296.10)
- nVidia GeForce GTX 550 Ti (ForceWare
296.10)
- nVidia GeForce GTX 470 (ForceWare
296.10)
- ASUS GeForce GTX 460 DCU Top 1GD5 (ForceWare
296.10)
- GIGABYTE GeForce GTX 460 1GB SOC (ForceWare
296.10)
- GIGABYTE GeForce GTX 460 1GB OC2 (ForceWare
296.10)
- GIGABYTE GeForce GTX 460 1GB OC (ForceWare
296.10)
- nVidia GeForce GTX 460 1GB (ForceWare
296.10)
- nVidia GeForce GTX 465 (ForceWare
296.10)
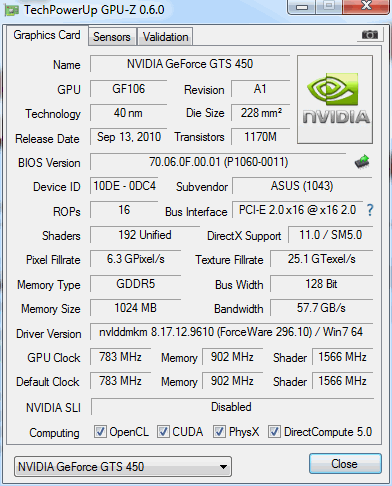
- ASUS GeForce GTS 450 DCU Top (ForceWare
296.10)
- ASUS GeForce GTS 450 DCU OC (ForceWare
296.10)
- ASUS GeForce GTS 450 (ForceWare 296.10)
- nVidia GeForce GTS 450 (ForceWare
296.10)
- ASUS GeForce GTS 450 DCU Silent DDR3 (ForceWare
296.10)
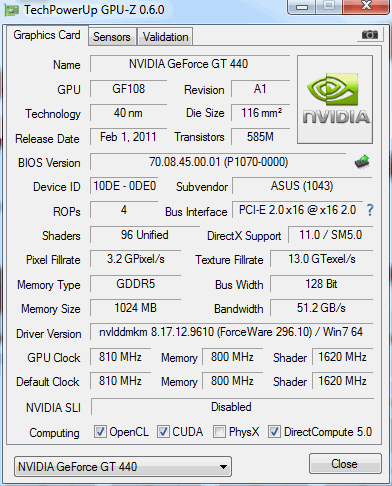
- ASUS GeForce GT 440 GD5 (ForceWare
296.10)
- nVidia GeForce GT 440 GDDR5 (ForceWare
296.10)
- AMD Radeon HD 7970
CrossFire (Catalyst 12.4)
- ASUS Radeon HD 7970 DirectCU II Top
(Catalyst 12.4)
- AMD Radeon HD 7970 (XFX Double
Dissipation) (Catalyst 12.4)
- AMD Radeon HD 7950
CrossFire (Catalyst 12.4)
- ASUS Radeon HD 7950 DirectCU II Top
(Catalyst 12.4)
- AMD Radeon HD 7950 (Catalyst 12.4)
- ASUS Radeon HD 7870 DirectCU II Top
CrossFire (Catalyst 12.4)
- ASUS Radeon HD 7870 DirectCU II Top
(Catalyst 12.4)
- AMD Radeon HD 7870 (Catalyst 12.4)
- ASUS Radeon HD 7850 DirectCU II Top
(Catalyst 12.4)
- Club3D Radeon HD 7750 Royal Queen
(Catalyst 12.4)
- AMD Radeon HD 6990 + HD 6970
CrossFire (Catalyst 12.3)
- AMD Radeon HD 6990 (Catalyst 12.3)
- ASUS Radeon HD 6970 DCU II (Catalyst
12.3)
- AMD Radeon HD 6970 (ASUS) (Catalyst
12.3)
- ASUS Radeon HD 6950 DCU II
CrossFire (Catalyst 12.3)
- ASUS Radeon HD 6950 DCU II (Catalyst
12.3)
- AMD Radeon HD 6950 2GB (ASUS) (Catalyst
12.3)
- ASUS Radeon HD 6870 DCU
CrossFire (Catalyst 12.3)
- ASUS Radeon HD 6870 DCU (Catalyst 12.3)
- AMD Radeon HD 6870 (Catalyst 12.3)
- AMD Radeon HD 6850
CrossFire (Catalyst 12.3)
- MSI Radeon HD 6850 Cyclone Power
Edition OC (Catalyst 12.3)
- MSI Radeon HD 6850 OC (Catalyst 12.3)
- ASUS Radeon HD 6850 DCU (Catalyst 12.3)
- AMD Radeon HD 6850 (Catalyst 12.3)
- AMD Radeon HD 6770 (ASUS DCU Silent)
(Catalyst 12.3)
- ASUS Radeon HD 6670 1GD5 (Catalyst
12.3)
- AMD Radeon HD 6670 1GB GDDR5 (Catalyst
12.3)
- AMD Radeon HD 6570 GDDR5 (Catalyst
12.3)
- AMD Radeon HD 5870
CrossFire (Catalyst 12.3)
- ASUS Radeon HD 5870 Matrix Platinum
(Catalyst 12.3)
- ASUS Radeon HD 5870 V2 S.T.A.L.K.E.R.
(Catalyst 12.3)
- ASUS Radeon HD 5870 Matrix (Catalyst
12.3)
- AMD Radeon HD 5870 (Catalyst 12.3)
- AMD Radeon HD 5850
CrossFire (Catalyst 12.3)
- ASUS Radeon HD 5850 DCU Top (Catalyst
12.3)
- MSI Radeon HD 5850 Twin Frozr II
(Catalyst 12.3)
- AMD Radeon HD 5850 (Catalyst 12.3)
- ASUS Radeon HD 5550 DDR3 (Catalyst
12.3)
|
| HDD |
- Samsung SSD 830 Series 128 GB
|
PSU
|
- Seasonic Platinum SS-1000XP / 1000 Watts
|
Discuss this article in the
forums
[pagebreak]
3DMark 11

| 3DMark
11 GPU |
Score |
Percent |
GPU-Z |
Review |
Gallery |
| nVidia GeForce GTX 660 Boost Max 1'033 MHz SLI (ForceWare 306.02)
| 12'411 |
166.50 % |
|
|
|
| nVidia GeForce GTX 680 Boost Max 1'059 MHz (ForceWare 301.25) |
9'149 |
122.74 % |
|
|
|
| ASUS GeForce GTX 660 Ti DCU II Top (Turbo up to 1'176 MHz) (ForceWare 303.53) |
8'605 |
115.44 % |
|
|
|
| AMD Radeon HD 7970 (XFX Double Dissipation) (Catalyst 12.4) | 7'862 |
105.47 % |
|
|
|
| nVidia GeForce GTX 670 Boost Max 980 MHz (ForceWare 301.25) |
7'594 |
101.88 % |
|
|
|
| nVidia GeForce GTX
660 Ti Boost Max 980 MHz (ForceWare 303.53) |
7'454 |
100.00 % |
|
|
|
| ASUS GeForce GTX 660 DCU II Top (Turbo up to 1'163 MHz) (ForceWare 306.02) |
6'884 |
92.35 % |
|
|
|
| EVGA GeForce GTX 660 SC SuperClocked (Turbo up to 1'150 MHz) (ForceWare 306.02)
| 6'711 |
90.03 % |
|
|
|
| AMD Radeon HD 7950 (Catalyst 12.4) |
6'598 |
88.52 % |
|
|
|
| AMD Radeon HD
7870 (Catalyst 12.4) |
6'256 |
83.93 % |
|
|
|
| GeForce GTX 660
Boost Max 1'033 MHz (ForceWare 306.02) |
6'231 |
83.59 % |
|
|
|
|
nVidia GeForce GTX 580 (ForceWare 296.10) |
5'945 |
79.76 % |
|
|
|
| nVidia GeForce GTX 570 (ForceWare 296.10) |
5'223 |
70.07 % |
|
|
|
| AMD Radeon HD 6950 2GB (ASUS) (Catalyst 12.3) |
4'777 |
64.09 % |
|
|
|
| nVidia GeForce GTX 560 Ti 1GB (ForceWare 296.10) |
4'148 |
55.65 % |
|
|
|
| AMD Radeon HD 6870 (Catalyst 12.3) |
4'036 |
54.15 % |
|
|
|
|
More is better |
|
Discuss this article in the
forums
[pagebreak]
3DMark Vantage

| 3DMark Vantage GPU |
Score |
Percent |
GPU-Z |
Review |
Gallery |
| nVidia GeForce GTX 660 Boost Max 1'033 MHz SLI (ForceWare 306.02)
| 37'990 |
141.95 % |
|
|
|
| nVidia GeForce GTX 680 Boost Max 1'059 MHz (ForceWare 301.25) |
32'283 |
120.63 % |
|
|
|
| AMD Radeon HD 7970 (XFX Double Dissipation) (Catalyst 12.4) | 30'766 |
114.96 % |
|
|
|
| ASUS GeForce GTX 660 Ti DCU II Top (Turbo up to 1'176 MHz) (ForceWare 303.53) |
29'187 |
109.06 % |
|
|
|
| nVidia GeForce GTX 670 Boost Max 980 MHz (ForceWare 301.25) |
29'145 |
108.90 % |
|
|
|
| AMD Radeon HD 7950 (Catalyst 12.4) |
27'128 |
101.36 % |
|
|
|
| nVidia GeForce GTX
660 Ti Boost Max 980 MHz (ForceWare 303.53) |
26'763 |
100.00 % |
|
|
|
| ASUS GeForce GTX 660 DCU II Top (Turbo up to 1'163 MHz) (ForceWare 306.02) |
26'211 |
97.94 % |
|
|
|
|
nVidia GeForce GTX 580 (ForceWare 296.10) |
25'394 |
94.88 % |
|
|
|
| EVGA GeForce GTX 660 SC SuperClocked (Turbo up to 1'150 MHz) (ForceWare 306.02)
| 25'393 |
94.88 % |
|
|
|
| GeForce GTX 660 Boost Max 1'033 MHz (ForceWare 306.02) |
24'267 |
90.67 % |
|
|
|
| AMD Radeon HD
7870 (Catalyst 12.4) |
24'200 |
90.42 % |
|
|
|
| nVidia GeForce GTX 570 (ForceWare 296.10) |
22'130 |
82.69 % |
|
|
|
| AMD Radeon HD 6950 2GB (ASUS) (Catalyst 12.3) |
19'571 |
73.13 % |
|
|
|
| nVidia GeForce GTX 560 Ti 1GB (ForceWare 296.10) |
18'304 |
68.39 % |
|
|
|
| AMD Radeon HD 6870 (Catalyst 12.3) |
16'829 |
62.88 % |
|
|
|
|
More is better |
|
Discuss this article in the
forums
[pagebreak]
Unigine Heaven

| Unigine Heaven DX11 Benchmark |
Score |
Percent |
GPU-Z |
Review |
Gallery |
| nVidia GeForce GTX 660 Boost Max 1'033 MHz SLI (ForceWare 306.02)
| 1'538 |
176.78 % |
|
|
|
| nVidia GeForce GTX 680 Boost Max 1'059 MHz (ForceWare 301.25) |
1'106 |
127.13 % |
|
|
|
| AMD Radeon HD 7970 (XFX Double Dissipation) (Catalyst 12.4) | 1'060 |
121.84 % |
|
|
|
| nVidia GeForce GTX 670 Boost Max 980 MHz (ForceWare 301.25) |
1'003 |
115.29 % |
|
|
|
| ASUS GeForce GTX 660 Ti DCU II Top (Turbo up to 1'176 MHz) (ForceWare 303.53) |
957 |
110.00 % |
|
|
|
| AMD Radeon HD 7950 (Catalyst 12.4) |
897 |
103.10 % |
|
|
|
| AMD Radeon HD
7870 (Catalyst 12.4) |
879 |
101.30 % |
|
|
|
| nVidia GeForce GTX
660 Ti Boost Max 980 MHz (ForceWare 303.53) |
870 |
100.00 % |
|
|
|
| ASUS GeForce GTX 660 DCU II Top (Turbo up to 1'163 MHz) (ForceWare 306.02) |
866 |
99.54 % |
|
|
|
|
nVidia GeForce GTX 580 (ForceWare 296.10) |
862 |
99.08 % |
|
|
|
| EVGA GeForce GTX 660 SC SuperClocked (Turbo up to 1'150 MHz) (ForceWare 306.02)
| 850 |
97.70 % |
|
|
|
| GeForce GTX 660 Boost Max 1'033 MHz (ForceWare 306.02) |
801 |
92.07 % |
|
|
|
| nVidia GeForce GTX 570 (ForceWare 296.10) |
728 |
83.68 % |
|
|
|
| AMD Radeon HD 6950 2GB (ASUS) (Catalyst 12.3) |
596 |
68.51 % |
|
|
|
| nVidia GeForce GTX 560 Ti 1GB (ForceWare 296.10) |
591 |
67.93 % |
|
|
|
| AMD Radeon HD 6870 (Catalyst 12.3) |
531 |
61.03 % |
|
|
|
|
More is better |
|
Discuss this article in the
forums
[pagebreak]
TessMark

| Geeks3D TessMark |
Score |
Percent |
GPU-Z |
Review |
Gallery |
| nVidia GeForce GTX 660 Boost Max 1'033 MHz SLI (ForceWare 306.02)
| 7'582 |
172.83 % |
|
|
|
| nVidia GeForce GTX 680 Boost Max 1'059 MHz (ForceWare 301.25) |
5'913 |
134.78 % |
|
|
|
| ASUS GeForce GTX 660 Ti DCU II Top (Turbo up to 1'176 MHz) (ForceWare 303.53) |
5'012 |
114.25 % |
|
|
|
| nVidia GeForce GTX 670 Boost Max 980 MHz (ForceWare 301.25) |
4'840 |
110.33 % |
|
|
|
| nVidia GeForce GTX
660 Ti Boost Max 980 MHz (ForceWare 303.53) |
4'387 |
100.00 % |
|
|
|
| ASUS GeForce GTX 660 DCU II Top (Turbo up to 1'163 MHz) (ForceWare 306.02) |
4'308 |
98.20 % |
|
|
|
| EVGA GeForce GTX 660 SC SuperClocked (Turbo up to 1'150 MHz) (ForceWare 306.02)
| 4'126 |
94.05 % |
|
|
|
| GeForce GTX 660 Boost Max 1'033 MHz (ForceWare 306.02) |
3'868 |
88.17 % |
|
|
|
|
nVidia GeForce GTX 580 (ForceWare 296.10) |
3'697 |
84.27 % |
|
|
|
| AMD Radeon HD 7970 (XFX Double Dissipation) (Catalyst 12.4) | 3'249 |
74.06 % |
|
|
|
| nVidia GeForce GTX 570 (ForceWare 296.10) |
3'206 |
73.08 % |
|
|
|
| AMD Radeon HD
7870 (Catalyst 12.4) |
3'179 |
72.46 % |
|
|
|
| AMD Radeon HD 7950 (Catalyst 12.4) |
2'806 |
63.96 % |
|
|
|
| nVidia GeForce GTX 560 Ti 1GB (ForceWare 296.10) |
2'177 |
49.62 % |
|
|
|
| AMD Radeon HD 6950 2GB (ASUS) (Catalyst 12.3) |
884 |
20.15 % |
|
|
|
| AMD Radeon HD 6870 (Catalyst 12.3) |
678 |
15.45 % |
|
|
|
|
More is better |
|
Discuss this article in the
forums
[pagebreak]
Alien vs Predator

| Alien vs Predator DX11 Benchmark |
Average |
Percent |
GPU-Z |
Review |
Gallery |
| nVidia GeForce GTX 660 Boost Max 1'033 MHz SLI (ForceWare 306.02)
| 80.8 fps |
187.04 % |
|
|
|
| AMD Radeon HD 7970 (XFX Double Dissipation) (Catalyst 12.4) | 65.7 fps |
152.08 % |
|
|
|
| nVidia GeForce GTX 680 Boost Max 1'059 MHz (ForceWare 301.25) |
56.1 fps |
129.86 % |
|
|
|
| AMD Radeon HD 7950 (Catalyst 12.4) |
55.3 fps |
128.01 % |
|
|
|
| nVidia GeForce GTX 670 Boost Max 980 MHz (ForceWare 301.25) |
53.2 fps |
123.15 % |
|
|
|
|
nVidia GeForce GTX 580 (ForceWare 296.10) |
46.8 fps |
108.33 % |
|
|
|
| AMD Radeon HD
7870 (Catalyst 12.4) |
46.3 fps |
107.18 % |
|
|
|
| ASUS GeForce GTX 660 Ti DCU II Top (Turbo up to 1'176 MHz) (ForceWare 303.53) |
45.4 fps |
105.09 % |
|
|
|
| ASUS GeForce GTX 660 DCU II Top (Turbo up to 1'163 MHz) (ForceWare 306.02) |
44.6 fps |
103.24 % |
|
|
|
| EVGA GeForce GTX 660 SC SuperClocked (Turbo up to 1'150 MHz) (ForceWare 306.02)
| 43.8 fps |
101.39 % |
|
|
|
| AMD Radeon HD 6950 2GB (ASUS) (Catalyst 12.3) |
43.5 fps |
100.69 % |
|
|
|
| nVidia GeForce GTX
660 Ti Boost Max 980 MHz (ForceWare 303.53) |
43.2 fps |
100.00 % |
|
|
|
| GeForce GTX 660 Boost Max 1'033 MHz (ForceWare 306.02) |
42.3 fps |
97.92 % |
|
|
|
| nVidia GeForce GTX 570 (ForceWare 296.10) |
39.5 fps |
91.44 % |
|
|
|
| AMD Radeon HD 6870 (Catalyst 12.3) |
36.8 fps |
85.19 % |
|
|
|
| nVidia GeForce GTX 560 Ti 1GB (ForceWare 296.10) |
32.9 fps |
76.16 % |
|
|
|
|
More is better |
|
Discuss this article in the
forums
[pagebreak]
Batman: Arkham City

| Batman: Arkham City Integrated Benchmark |
Average |
Percent |
GPU-Z |
Review |
Gallery |
| nVidia GeForce GTX 660 Boost Max 1'033 MHz SLI (ForceWare 306.02)
| 101 fps |
174.14 % |
|
|
|
| AMD Radeon HD 7970 (XFX Double Dissipation) (Catalyst 12.4) | 79 fps |
136.21 % |
|
|
|
| nVidia GeForce GTX 680 Boost Max 1'059 MHz (ForceWare 301.25) |
72 fps |
124.14 % |
|
|
|
| nVidia GeForce GTX 670 Boost Max 980 MHz (ForceWare 301.25) |
70 fps |
120.69 % |
|
|
|
| AMD Radeon HD 7950 (Catalyst 12.4) |
67 fps |
115.52 % |
|
|
|
| ASUS GeForce GTX 660 Ti DCU II Top (Turbo up to 1'176 MHz) (ForceWare 303.53) |
61 fps |
105.17 % |
|
|
|
| ASUS GeForce GTX 660 DCU II Top (Turbo up to 1'163 MHz) (ForceWare 306.02) |
61 fps |
105.17 % |
|
|
|
| AMD Radeon HD
7870 (Catalyst 12.4) |
61 fps |
105.17 % |
|
|
|
| EVGA GeForce GTX 660 SC SuperClocked (Turbo up to 1'150 MHz) (ForceWare 306.02)
| 60 fps |
103.45 % |
|
|
|
| nVidia GeForce GTX
660 Ti Boost Max 980 MHz (ForceWare 303.53) |
58 fps |
100.00 % |
|
|
|
| GeForce GTX 660 Boost Max 1'033 MHz (ForceWare 306.02) |
58 fps |
100.00 % |
|
|
|
|
nVidia GeForce GTX 580 (ForceWare 296.10) |
54 fps |
93.10 % |
|
|
|
| nVidia GeForce GTX 570 (ForceWare 296.10) |
46 fps |
79.31 % |
|
|
|
| AMD Radeon HD 6950 2GB (ASUS) (Catalyst 12.3) |
42 fps |
72.41 % |
|
|
|
| nVidia GeForce GTX 560 Ti 1GB (ForceWare 296.10) |
40 fps |
68.97 % |
|
|
|
| AMD Radeon HD 6870 (Catalyst 12.3) |
38 fps |
65.52 % |
|
|
|
|
More is better |
|
Discuss this article in the
forums
[pagebreak]
DIRT 2

| DIRT 2 Integrated Benchmark |
Average |
Percent |
GPU-Z |
Review |
Gallery |
| nVidia GeForce GTX 660 Boost Max 1'033 MHz SLI (ForceWare 306.02)
| 142.3 fps |
141.31 % |
|
|
|
| nVidia GeForce GTX 680 Boost Max 1'059 MHz (ForceWare 301.25) |
131.6 fps |
130.69 % |
|
|
|
| nVidia GeForce GTX 670 Boost Max 980 MHz (ForceWare 301.25) |
125.0 fps |
124.13 % |
|
|
|
| AMD Radeon HD 7970 (XFX Double Dissipation) (Catalyst 12.4) | 119.8 fps |
118.97 % |
|
|
|
| ASUS GeForce GTX 660 DCU II Top (Turbo up to 1'163 MHz) (ForceWare 306.02) |
108.0 fps |
107.25 % |
|
|
|
| ASUS GeForce GTX 660 Ti DCU II Top (Turbo up to 1'176 MHz) (ForceWare 303.53) |
107.7 fps |
106.95 % |
|
|
|
|
nVidia GeForce GTX 580 (ForceWare 296.10) |
107.7 fps |
106.95 % |
|
|
|
| EVGA GeForce GTX 660 SC SuperClocked (Turbo up to 1'150 MHz) (ForceWare 306.02)
| 105.9 fps |
105.16 % |
|
|
|
| AMD Radeon HD 7950 (Catalyst 12.4) |
103.2 fps |
102.48 % |
|
|
|
| GeForce GTX 660 Boost Max 1'033 MHz (ForceWare 306.02) |
101.9 fps |
101.19 % |
|
|
|
| nVidia GeForce GTX
660 Ti Boost Max 980 MHz (ForceWare 303.53) |
100.7 fps |
100.00 % |
|
|
|
| AMD Radeon HD
7870 (Catalyst 12.4) |
95.9 fps |
95.23 % |
|
|
|
| nVidia GeForce GTX 570 (ForceWare 296.10) |
92.7 fps |
92.06 % |
|
|
|
| AMD Radeon HD 6950 2GB (ASUS) (Catalyst 12.3) |
80.9 fps |
80.34 % |
|
|
|
| nVidia GeForce GTX 560 Ti 1GB (ForceWare 296.10) |
78.6 fps |
78.05 % |
|
|
|
| AMD Radeon HD 6870 (Catalyst 12.3) |
71.9 fps |
71.40 % |
|
|
|
|
More is better |
|
Discuss this article in the
forums
[pagebreak]
Call Of Duty Modern Warfare 3

| Call Of Duty Modern Warfare 3 (5 Minutes GamePlay) |
Average |
Percent |
GPU-Z |
Review |
Gallery |
| nVidia GeForce GTX 660 Boost Max 1'033 MHz SLI (ForceWare 306.02)
| 163.93 fps |
110.80 % |
|
|
|
| ASUS GeForce GTX 660 Ti DCU II Top (Turbo up to 1'176 MHz) (ForceWare 303.53) |
153.2 fps |
103.55 % |
|
|
|
| nVidia GeForce GTX
660 Ti Boost Max 980 MHz (ForceWare 303.53) |
147.95 fps |
100.00 % |
|
|
|
| ASUS GeForce GTX 660 DCU II Top (Turbo up to 1'163 MHz) (ForceWare 306.02) |
145.68 fps |
98.46 % |
|
|
|
| nVidia GeForce GTX 680 Boost Max 1'059 MHz (ForceWare 301.25) |
145.28 fps |
98.20 % |
|
|
|
| EVGA GeForce GTX 660 SC SuperClocked (Turbo up to 1'150 MHz) (ForceWare 306.02)
| 143.65 fps |
97.09 % |
|
|
|
| GeForce GTX 660 Boost Max 1'033 MHz (ForceWare 306.02) |
138.05 fps |
93.31 % |
|
|
|
| nVidia GeForce GTX 670 Boost Max 980 MHz (ForceWare 301.25) |
136.85 fps |
92.50 % |
|
|
|
| AMD Radeon HD 7970 (XFX Double Dissipation) (Catalyst 12.4) | 133.80 fps |
90.44 % |
|
|
|
|
nVidia GeForce GTX 580 (ForceWare 296.10) |
126.58 fps |
85.56 % |
|
|
|
| AMD Radeon HD 7950 (Catalyst 12.4) |
122.15 fps |
82.56 % |
|
|
|
| nVidia GeForce GTX 570 (ForceWare 296.10) |
117.83 fps |
79.64 % |
|
|
|
| AMD Radeon HD
7870 (Catalyst 12.4) |
114.98 fps |
77.72 % |
|
|
|
| AMD Radeon HD 6950 2GB (ASUS) (Catalyst 12.3) |
109.30 fps |
73.88 % |
|
|
|
| nVidia GeForce GTX 560 Ti 1GB (ForceWare 296.10) |
104.20 fps |
70.43 % |
|
|
|
| AMD Radeon HD 6870 (Catalyst 12.3) |
100.05 fps |
67.62 % |
|
|
|
|
More is better |
|

[pagebreak]
BattleField 3

| BattleField 3 (5 Minutes GamePlay) |
Average |
Percent |
GPU-Z |
Review |
Gallery |
| nVidia GeForce GTX 660 Boost Max 1'033 MHz SLI (ForceWare 306.02)
| 75.58 fps |
160.53 % |
|
|
|
| nVidia GeForce GTX 680 Boost Max 1'059 MHz (ForceWare 301.25) |
58.57 fps |
124.40 % |
|
|
|
| ASUS GeForce GTX 660 Ti DCU II Top (Turbo up to 1'176 MHz) (ForceWare 303.53) |
53.80 fps |
114.27 % |
|
|
|
| nVidia GeForce GTX 670 Boost Max 980 MHz (ForceWare 301.25) |
52.97 fps |
112.50 % |
|
|
|
| EVGA GeForce GTX 660 SC SuperClocked (Turbo up to 1'150 MHz) (ForceWare 306.02)
| 47.55 fps |
100.99 % |
|
|
|
| ASUS GeForce GTX 660 DCU II Top (Turbo up to 1'163 MHz) (ForceWare 306.02) |
47.32 fps |
100.50 % |
|
|
|
| AMD Radeon HD 7970 (XFX Double Dissipation) (Catalyst 12.4) | 47.32 fps |
100.50 % |
|
|
|
| nVidia GeForce GTX
660 Ti Boost Max 980 MHz (ForceWare 303.53) |
47.08 fps |
100.00 % |
|
|
|
| GeForce GTX 660 Boost Max 1'033 MHz (ForceWare 306.02) |
43.55 fps |
92.50 % |
|
|
|
|
nVidia GeForce GTX 580 (ForceWare 296.10) |
43.10 fps |
91.54 % |
|
|
|
| AMD Radeon HD
7870 (Catalyst 12.4) |
41.12 fps |
87.34 % |
|
|
|
| AMD Radeon HD 7950 (Catalyst 12.4) |
40.43 fps |
85.87 % |
|
|
|
| nVidia GeForce GTX 570 (ForceWare 296.10) |
39.58 fps |
84.06 % |
|
|
|
| nVidia GeForce GTX 560 Ti 1GB (ForceWare 296.10) |
33.75 fps |
71.68 % |
|
|
|
| AMD Radeon HD 6950 2GB (ASUS) (Catalyst 12.3) |
30.93 fps |
65.69 % |
|
|
|
| AMD Radeon HD 6870 (Catalyst 12.3) |
28.95 fps |
61.49 % |
|
|
|
|
More is better |
|
Discuss this article in the
forums
[pagebreak]
Crysis 2

| Crysis 2 DX11 + HiRes Texture Pack Benchmark |
Average |
Percent |
GPU-Z |
Review |
Gallery |
| nVidia GeForce GTX 660 Boost Max 1'033 MHz SLI (ForceWare 306.02)
| 84.0 fps |
160.92 % |
|
|
|
| nVidia GeForce GTX 680 Boost Max 1'059 MHz (ForceWare 301.25) |
66.8 fps |
127.97 % |
|
|
|
| nVidia GeForce GTX 670 Boost Max 980 MHz (ForceWare 301.25) |
58.9 fps |
112.84 % |
|
|
|
| ASUS GeForce GTX 660 Ti DCU II Top (Turbo up to 1'176 MHz) (ForceWare 303.53) |
57.5 fps |
110.15 % |
|
|
|
| AMD Radeon HD 7970 (XFX Double Dissipation) (Catalyst 12.4) | 53.2 fps |
101.92 % |
|
|
|
| nVidia GeForce GTX
660 Ti Boost Max 980 MHz (ForceWare 303.53) |
52.2 fps |
100.00 % |
|
|
|
| ASUS GeForce GTX 660 DCU II Top (Turbo up to 1'163 MHz) (ForceWare 306.02) |
50.4 fps |
96.55 % |
|
|
|
| EVGA GeForce GTX 660 SC SuperClocked (Turbo up to 1'150 MHz) (ForceWare 306.02)
| 49.1 fps |
94.06 % |
|
|
|
|
nVidia GeForce GTX 580 (ForceWare 296.10) |
47.5 fps |
91.00 % |
|
|
|
| GeForce GTX 660 Boost Max 1'033 MHz (ForceWare 306.02) |
46.3 fps |
88.70 % |
|
|
|
| AMD Radeon HD 7950 (Catalyst 12.4) |
45.2 fps |
86.59 % |
|
|
|
| AMD Radeon HD
7870 (Catalyst 12.4) |
43.2 fps |
82.76 % |
|
|
|
| nVidia GeForce GTX 570 (ForceWare 296.10) |
40.9 fps |
78.35 % |
|
|
|
| nVidia GeForce GTX 560 Ti 1GB (ForceWare 296.10) |
33.1 fps |
63.41 % |
|
|
|
| AMD Radeon HD 6950 2GB (ASUS) (Catalyst 12.3) |
27.4 fps |
52.49 % |
|
|
|
| AMD Radeon HD 6870 (Catalyst 12.3) |
26.5 fps |
50.77 % |
|
|
|
|
More is better |
|
Discuss this article in the
forums
[pagebreak]
Dragon Age 2

| Dragon Age II (5 Minutes GamePlay) |
Average |
Percent |
GPU-Z |
Review |
Gallery |
| nVidia GeForce GTX 660 Boost Max 1'033 MHz SLI (ForceWare 306.02)
| 74.67 fps |
164.10 % |
|
|
|
| nVidia GeForce GTX 680 Boost Max 1'059 MHz (ForceWare 301.25) |
55.35 fps |
121.65 % |
|
|
|
| ASUS GeForce GTX 660 Ti DCU II Top (Turbo up to 1'176 MHz) (ForceWare 303.53) |
51.23 fps |
112.60 % |
|
|
|
| AMD Radeon HD 7970 (XFX Double Dissipation) (Catalyst 12.4) | 51.05 fps |
112.20 % |
|
|
|
| nVidia GeForce GTX 670 Boost Max 980 MHz (ForceWare 301.25) |
48.00 fps |
105.49 % |
|
|
|
|
nVidia GeForce GTX 580 (ForceWare 296.10) |
46.93 fps |
103.14 % |
|
|
|
| nVidia GeForce GTX
660 Ti Boost Max 980 MHz (ForceWare 303.53) |
45.50 fps |
100.00 % |
|
|
|
| AMD Radeon HD 7950 (Catalyst 12.4) |
43.53 fps |
95.67 % |
|
|
|
| nVidia GeForce GTX 570 (ForceWare 296.10) |
41.85 fps |
91.98 % |
|
|
|
| ASUS GeForce GTX 660 DCU II Top (Turbo up to 1'163 MHz) (ForceWare 306.02) |
41.13 fps |
90.40 % |
|
|
|
| EVGA GeForce GTX 660 SC SuperClocked (Turbo up to 1'150 MHz) (ForceWare 306.02)
| 39.73 fps |
87.33 % |
|
|
|
| AMD Radeon HD
7870 (Catalyst 12.4) |
37.00 fps |
81.32 % |
|
|
|
| GeForce GTX 660 Boost Max 1'033 MHz (ForceWare 306.02) |
36.89 fps |
81.07 % |
|
|
|
| AMD Radeon HD 6950 2GB (ASUS) (Catalyst 12.3) |
35.03 fps |
76.99 % |
|
|
|
| nVidia GeForce GTX 560 Ti 1GB (ForceWare 296.10) |
31.05 fps |
68.24 % |
|
|
|
| AMD Radeon HD 6870 (Catalyst 12.3) |
28.75 fps |
63.19 % |
|
|
|
|
More is better |
|
Discuss this article in the
forums
[pagebreak]
S.T.A.L.K.E.R. Call of Pripyat

| S.T.A.L.K.E.R. Call of Pripyat Benchmark |
Average |
Percent |
GPU-Z |
Review |
Gallery |
| nVidia GeForce GTX 660 Boost Max 1'033 MHz SLI (ForceWare 306.02)
| 79.85 fps |
179.44 % |
|
|
|
| nVidia GeForce GTX 680 Boost Max 1'059 MHz (ForceWare 301.25) |
59.28 fps |
133.21 % |
|
|
|
| nVidia GeForce GTX 670 Boost Max 980 MHz (ForceWare 301.25) |
54.35 fps |
122.13 % |
|
|
|
| AMD Radeon HD 7970 (XFX Double Dissipation) (Catalyst 12.4) | 49.98 fps |
112.31 % |
|
|
|
| ASUS GeForce GTX 660 Ti DCU II Top (Turbo up to 1'176 MHz) (ForceWare 303.53) |
47.55 fps |
106.85 % |
|
|
|
| ASUS GeForce GTX 660 DCU II Top (Turbo up to 1'163 MHz) (ForceWare 306.02) |
45.45 fps |
102.13 % |
|
|
|
| nVidia GeForce GTX
660 Ti Boost Max 980 MHz (ForceWare 303.53) |
44.50 fps |
100.00 % |
|
|
|
| EVGA GeForce GTX 660 SC SuperClocked (Turbo up to 1'150 MHz) (ForceWare 306.02)
| 43.75 fps |
98.31 % |
|
|
|
|
nVidia GeForce GTX 580 (ForceWare 296.10) |
41.50 fps |
93.26 % |
|
|
|
| GeForce GTX 660 Boost Max 1'033 MHz (ForceWare 306.02) |
41.45 fps |
93.15 % |
|
|
|
| AMD Radeon HD 7950 (Catalyst 12.4) |
40.15 fps |
90.22 % |
|
|
|
| AMD Radeon HD
7870 (Catalyst 12.4) |
36.25 fps |
81.46 % |
|
|
|
| nVidia GeForce GTX 570 (ForceWare 296.10) |
35.63 fps |
80.07 % |
|
|
|
| AMD Radeon HD 6950 2GB (ASUS) (Catalyst 12.3) |
30.74 fps |
69.08 % |
|
|
|
| nVidia GeForce GTX 560 Ti 1GB (ForceWare 296.10) |
30.00 fps |
67.42 % |
|
|
|
| AMD Radeon HD 6870 (Catalyst 12.3) |
24.43 fps |
54.90 % |
|
|
|
|
More is better |
|
Discuss this article in the
forums
[pagebreak]
The Elder Scrolls V: Skyrim

| The Elder Scrolls V: Skyrim (5 Minutes GamePlay) |
Average |
Percent |
GPU-Z |
Review |
Gallery |
| nVidia GeForce GTX 660 Boost Max 1'033 MHz SLI (ForceWare 306.02)
| 92.66 fps |
147.84 % |
|
|
|
| nVidia GeForce GTX 680 Boost Max 1'059 MHz (ForceWare 301.25) |
80.43 fps |
128.33 % |
|
|
|
|
nVidia GeForce GTX 580 (ForceWare 296.10) |
76.87 fps |
122.65 % |
|
|
|
| nVidia GeForce GTX 670 Boost Max 980 MHz (ForceWare 301.25) |
73.64 fps |
117.50 % |
|
|
|
| ASUS GeForce GTX 660 Ti DCU II Top (Turbo up to 1'176 MHz) (ForceWare 303.53) |
67.00 fps |
106.90 % |
|
|
|
| nVidia GeForce GTX
660 Ti Boost Max 980 MHz (ForceWare 303.53) |
62.68 fps |
100.00 % |
|
|
|
| ASUS GeForce GTX 660 DCU II Top (Turbo up to 1'163 MHz) (ForceWare 306.02) |
62.05 fps |
99.00 % |
|
|
|
| EVGA GeForce GTX 660 SC SuperClocked (Turbo up to 1'150 MHz) (ForceWare 306.02)
| 61.10 fps |
97.49 % |
|
|
|
| AMD Radeon HD 7970 (XFX Double Dissipation) (Catalyst 12.4) | 60.68 fps |
96.82 % |
|
|
|
| nVidia GeForce GTX 570 (ForceWare 296.10) |
60.22 fps |
96.08 % |
|
|
|
| AMD Radeon HD 7950 (Catalyst 12.4) |
59.35 fps |
94.69 % |
|
|
|
| GeForce GTX 660 Boost Max 1'033 MHz (ForceWare 306.02) |
58.61 fps |
93.51 % |
|
|
|
| AMD Radeon HD
7870 (Catalyst 12.4) |
53.61 fps |
85.54 % |
|
|
|
| nVidia GeForce GTX 560 Ti 1GB (ForceWare 296.10) |
51.10 fps |
81.53 % |
|
|
|
| AMD Radeon HD 6950 2GB (ASUS) (Catalyst 12.3) |
50.28 fps |
80.22 % |
|
|
|
| AMD Radeon HD 6870 (Catalyst 12.3) |
44.21 fps |
70.54 % |
|
|
|
|
More is better |
|
Discuss this article in the
forums
[pagebreak]
StarCraft II

| StarCraft II (5 Minutes GamePlay) |
Average |
Percent |
GPU-Z |
Review |
Gallery |
| AMD Radeon HD 7970 (XFX Double Dissipation) (Catalyst 12.4) | 88.58 fps |
116.52 % |
|
|
|
| AMD Radeon HD
7870 (Catalyst 12.4) |
87.82 fps |
115.52 % |
|
|
|
| nVidia GeForce GTX 660 Boost Max 1'033 MHz SLI (ForceWare 306.02)
| 81.31 fps |
106.96 % |
|
|
|
| AMD Radeon HD 6950 2GB (ASUS) (Catalyst 12.3) |
80.96 fps |
106.50 % |
|
|
|
| AMD Radeon HD 6870 (Catalyst 12.3) |
80.33 fps |
105.67 % |
|
|
|
| nVidia GeForce GTX 680 Boost Max 1'059 MHz (ForceWare 301.25) |
77.94 fps |
102.53 % |
|
|
|
|
nVidia GeForce GTX 580 (ForceWare 296.10) |
76.92 fps |
101.18 % |
|
|
|
| ASUS GeForce GTX 660 Ti DCU II Top (Turbo up to 1'176 MHz) (ForceWare 303.53) |
76.42 fps |
100.52 % |
|
|
|
| nVidia GeForce GTX
660 Ti Boost Max 980 MHz (ForceWare 303.53) |
76.02 fps |
100.00 % |
|
|
|
| EVGA GeForce GTX 660 SC SuperClocked (Turbo up to 1'150 MHz) (ForceWare 306.02)
| 75.93 fps |
99.89 % |
|
|
|
| ASUS GeForce GTX 660 DCU II Top (Turbo up to 1'163 MHz) (ForceWare 306.02) |
75.74 fps |
99.63 % |
|
|
|
| GeForce GTX 660 Boost Max 1'033 MHz (ForceWare 306.02) |
75.70 fps |
99.58 % |
|
|
|
| nVidia GeForce GTX 670 Boost Max 980 MHz (ForceWare 301.25) |
75.23 fps |
98.96 % |
|
|
|
| nVidia GeForce GTX 570 (ForceWare 296.10) |
74.84 fps |
98.45 % |
|
|
|
| nVidia GeForce GTX 560 Ti 1GB (ForceWare 296.10) |
74.16 fps |
97.55 % |
|
|
|
|
More is better |
|
Discuss this article in the
forums
[pagebreak]
Power
Consumption

| Power Consumption
Idle |
Power
Consumption |
Percent |
GPU-Z |
Review |
Gallery |
|
nVidia GeForce GTX 580 (ForceWare 296.10) |
91.5 Watts |
127.08 % |
|
|
|
| ASUS GeForce GTX 570 DCU II (ForceWare 296.10) |
83.0 Watts |
115.28 % |
|
|
|
| AMD Radeon HD 6950 2GB (ASUS) (Catalyst 12.3) |
73.0 Watts |
101.39 % |
|
|
|
| nVidia GeForce GTX 660 Boost Max 1'033 MHz SLI (ForceWare 306.02)
| 73.0 Watts |
101.39 % |
|
|
|
| ASUS GeForce GTX 660 Ti DCU II Top (Turbo up to 1'176 MHz) (ForceWare 303.53) |
72.0 Watts |
100.00 % |
|
|
|
| ASUS GeForce GTX 560 Ti DCU II Top 1GD5 (ForceWare 296.10) |
72.0 Watts |
100.00 % |
|
|
|
| AMD Radeon HD 6870 (Catalyst 12.3) |
70.5 Watts |
97.92 % |
|
|
|
| ASUS GeForce GTX 670 DCU II Top (ForceWare
301.25) |
69.0 Watts |
95.83 % |
|
|
|
| nVidia GeForce GTX 680 (ForceWare 301.10) |
68.5 Watts |
95.14 % |
|
|
|
| ASUS GeForce GTX 660 DCU II Top (Turbo up to 1'163 MHz) (ForceWare 306.02) |
67.0 Watts |
93.06 % |
|
|
|
| AMD Radeon HD 7970 (XFX Double Dissipation) (Catalyst 12.4) | 65.0 Watts |
90.28 % |
|
|
|
| ASUS Radeon HD
7870 DirectCU II Top (Catalyst 12.4) |
60.0 Watts |
83.33 % |
|
|
|
| EVGA GeForce GTX 660 SC SuperClocked (Turbo up to 1'150 MHz) (ForceWare 306.02)
| 60.0 Watts |
83.33 % |
|
|
|
|
Less is
better |
|
| Power Consumption Load (FurMark) |
Power
Consumption |
Percent |
GPU-Z |
Review |
Gallery |
|
nVidia GeForce GTX 580 (ForceWare 296.10)
(No Throttling) |
330.0 Watts |
163.37 % |
|
|
|
| nVidia GeForce GTX 660 Boost Max 1'033 MHz SLI (ForceWare 306.02)
| 295.0 Watts |
146.04 % |
|
|
|
| ASUS GeForce GTX 570 DCU II (ForceWare 296.10) |
262.0 Watts |
129.70 % |
|
|
|
| ASUS GeForce GTX 560 Ti DCU II Top 1GD5 (ForceWare 296.10) |
258.0 Watts |
127.72 % |
|
|
|
| AMD Radeon HD 7970 (XFX Double Dissipation) (Catalyst 12.4) | 252.0 Watts |
124.75 % |
|
|
|
| nVidia GeForce GTX 680 (ForceWare 301.10) |
240.0 Watts |
118.81 % |
|
|
|
| ASUS GeForce GTX 670 DCU II Top (ForceWare
301.25) |
229.0 Watts |
113.37 % |
|
|
|
| AMD Radeon HD 6950 2GB (ASUS) (Catalyst 12.3) |
212.0 Watts |
104.95 % |
|
|
|
| ASUS GeForce GTX 660 Ti DCU II Top (Turbo up to 1'176 MHz) (ForceWare 303.53) |
202.0 Watts |
100.00 % |
|
|
|
| EVGA GeForce GTX 660 SC SuperClocked (Turbo up to 1'150 MHz) (ForceWare 306.02)
| 200.0 Watts |
99.01 % |
|
|
|
| AMD Radeon HD 6870 (Catalyst 12.3) |
195.0 Watts |
96.53 % |
|
|
|
| ASUS Radeon HD
7870 DirectCU II Top (Catalyst 12.4) |
193.0 Watts |
95.54 % |
|
|
|
| ASUS GeForce GTX 660 DCU II Top (Turbo up to 1'163 MHz) (ForceWare 306.02) |
190.0 Watts |
94.06 % |
|
|
|
|
Less is
better |
|
| Difference Idle/Load |
Power
Consumption |
Percent |
GPU-Z |
Review |
Gallery |
|
nVidia GeForce GTX 580 (ForceWare 296.10)
(No Throttling) |
238.5 Watts |
183.46 % |
|
|
|
| nVidia GeForce GTX 660 Boost Max 1'033 MHz SLI (ForceWare 306.02)
| 222.0 Watts |
146.04 % |
|
|
|
| AMD Radeon HD 7970 (XFX Double Dissipation) (Catalyst 12.4) | 187.0 Watts |
143.85 % |
|
|
|
| ASUS GeForce GTX 560 Ti DCU II Top 1GD5 (ForceWare 296.10) |
186.0 Watts |
127.72 % |
|
|
|
| ASUS GeForce GTX 570 DCU II (ForceWare 296.10) |
179.0 Watts |
137.69 % |
|
|
|
| nVidia GeForce GTX 680 (ForceWare 301.10) |
171.5 Watts |
131.92 % |
|
|
|
| ASUS GeForce GTX 670 DCU II Top (ForceWare
301.25) |
160.0 Watts |
123.08 % |
|
|
|
| EVGA GeForce GTX 660 SC SuperClocked (Turbo up to 1'150 MHz) (ForceWare 306.02)
| 140.0 Watts |
107.69 % |
|
|
|
| AMD Radeon HD 6950 2GB (ASUS) (Catalyst 12.3) |
139.0 Watts |
106.92 % |
|
|
|
| ASUS Radeon HD
7870 DirectCU II Top (Catalyst 12.4) |
133.0 Watts |
102.31 % |
|
|
|
| ASUS GeForce GTX 660 Ti DCU II Top (Turbo up to 1'176 MHz) (ForceWare 303.53) |
130.0 Watts |
100.00 % |
|
|
|
| AMD Radeon HD 6870 (Catalyst 12.3) |
124.5 Watts |
95.77 % |
|
|
|
| ASUS GeForce GTX 660 DCU II Top (Turbo up to 1'163 MHz) (ForceWare 306.02) |
123.0 Watts |
94.62 % |
|
|
|
|
More is better |
|
Discuss this article in the
forums
[pagebreak]
BenchMarks and Games
Settings
Futuremark
- 3DMark 11
(1.0.3)
- GPU Test - Performance Preset
- 3DMark Vantage (1.1.0)
- GPU Test - Performance Preset
Unigine Heaven DX11 Benchmark
|
|
| Version |
3.0 |
| API |
DirectX 11 |
| Tessellation |
Extreme |
| Shaders |
High |
| Anisotropy |
16x |
| Stereo
3D |
Disabled |
| Anti-aliasing |
8x |
| Full
Screen |
Yes |
| Resolution |
1920 x 1080 |
Geeks3D TessMark
|
|
| Version |
0.3.0 |
| Map Set |
Set 4 (2048 x 2048) |
| Tesselation |
Insane (x64) |
| Full
Screen |
Yes |
| Resolution |
1920 x 1080 |
| Anti-aliasing |
8x |
| Tessellation |
High |
| Duration |
60000 (ms) |
Geeks3D FurMark (Burn-in test)
|
|
| Version |
1.10.0 |
| Full
Screen |
Yes |
| Resolution |
1920 x 1080 |
| Anti-aliasing |
8x MSAA |
Alien vs Predator DX11 Benchmark
|
|
| Texture Quality |
Very High |
| Shadow Quality |
High |
| Hardware Tesselation |
Yes |
| Advance Shadow Sampling |
Yes |
| Full Srceen Anti-Aliasing Samples |
4x |
| Anisotropic Filtering |
16x |
| SSAO |
On |
| Screen Resolution |
1920 x 1080 |
Batman: Arkham City Integrated Benchmark
|
|
| FullScreen |
Yes |
| Resolution |
1920 x 1080 |
| V Sync |
No |
| Anti-Aliasing |
8x MSAA |
| Stereoscopic 3D Status |
No |
| DirectX 11 Features |
MVSS And HBAO |
| DirectX 11 Tesselation |
High |
| Detail Level |
Extreme |
| Dynamic Shadow |
Yes |
| Motion Blur |
Yes |
| Distortion |
Yes |
| Lens Flares |
Yes |
| Light Shafts |
Yes |
| Reflections |
Yes |
| Ambient Occlusion |
Yes |
| Hardware Accelerated PhysX |
Off |
Call Of Duty Modern Warfare 3 (5 Minutes GamePlay)
|
|
| Resolution |
1920 x 1080 |
| FullScreen |
On |
| Vertical Sync |
Off |
| Field of view |
70 |
| Motion Blur Amount |
Max |
| Graphics Quality |
Ultra |
BattleField 3 (5 Minutes GamePlay)
|
|
| Resolution |
1920 x 1080 |
| Aspect Ratio |
Wide 16:9 |
| Anti-Aliasing |
4x |
| Screen Refresh Rate |
60 Hz |
| Sync Every Frame |
No |
| Shadows |
Yes |
| Specular Map |
Yes |
| Depth Of Field |
Yes |
| Screen Space Ambient Occlusion |
High Quality |
| Soften Smoke Edges |
Yes |
| Bullet Impacts |
Yes |
| Image Quality |
Ultra |
Crysis 2 DX11 + HiRes Texture Pack Benchmark
|
|
| Quality |
Ultra |
| Resolution |
1920 x 1080 |
| Anti-Aliasing |
4x |
| Map |
Central Park/Adrenaline |
| Runs |
1 |
| API |
DirectX 11 |
| Edge AA |
Edge AA |
| Hi-Res Textures |
On |
DIRT 2 Integrated Benchmark
|
|
| Resolution |
1920 x 1080 |
| Refresh Rate |
60 |
| MultiSampling |
8x MSAA |
| VSync |
Off |
| Aspect Ration |
16:9 |
| Details |
Ultra Preset |
Dragon Age II (5 Minutes GamePlay)
|
|
| Resolution |
1920 x 1080 |
| Full Screen Mode |
Yes |
| Renderer |
DirectX 11 |
| Vertical Sync |
no |
| Graphics Detail |
Very High |
| Anti-Aliasing |
8x |
| Anisotropic Filtering |
16x |
| Screen Space Ambient Occlusion |
Yes |
| Diffusion Depth of Field |
Yes |
| High Quality Blur |
Yes |
StarCraft II (5 Minutes GamePlay)
|
|
| Display Mode |
FullScreen |
| Refresh Rate |
Default |
| Resolution |
1920 x 180 |
| Vertical Sync |
No |
| Texture Quality |
Ultra |
| Graphics Quality |
Ultra |
The Elder Scrolls V: Skyrim (5 Minutes GamePlay)
|
|
| Resolution |
1920 x 1080 |
| Aspect Ratio |
Wide 16:9 |
| Anti-Aliasing |
8x |
| Anisotropic-Filtering |
16x |
| Details |
Ultra |
| Vertical Sync |
Disabled |
S.T.A.L.K.E.R. Call of Pripyat Benchmark
|
|
| Preset |
Ultra |
| Renderer |
Enhan. full dyn. lighting (DX11) |
| Video Mode |
1920 x 1080 |
| MSAA |
4x |
| MSAA for A-tested objects |
DX10.0 Style [Standard] |
| SSAO Mode |
HDAO |
| SSAO Quality |
High |
| Use DX10.1 |
No |
| Enable Tesselation |
Yes |
| Contact Hardening Shadows |
Yes |
Discuss this article in the
forums
[pagebreak]
Conclusion
|
General |
|
+ |
- |
| With the GeForce GTX 660 NVIDIA really succeeded in releasing a
midrange graphics card which offers an excellent price/performanc ratio.
For as little as 189 Euros (est. CHF 223.-) you get a card that is
indeed more then 60 percent faster than the still widely spread GeForce
GTX 460. In our benchmarking parcours the GTX 660 was even capable of
leaving the Radeon HD 7870 about 3 percent behind on average.
Furthermore there is the power consumption, which also is on an
excellent level: 60 Watt idle and 195 Watt under load, that's what we
measured with our test setup. |
|
- Price
- Performance
- Power Consumption |
|
| |
|
|
|
| Performance |
|
+ |
- |
Looking at ingame performance one
can see that the GTX 660 is about five percent slower than the GTX 660
Ti. As a side note we want to mention that the GTX 660 Ti is as fast the
former high-end card GTX 580. In other words: for 20 percent less you
get a card that is only five percent slower, since the price fot the GTX
660 is 189 Euros and the price for the GTX 660 Ti is about 220 Euros. In
our opinion this looks like a great deal! Furthermore comparing the
results to a Radeon HD 7870 we saw that the GTX 660 can keep up even
with this card.
In this review we were not only looking at single GPU performance we
also tested a GTX 660 SLI configuration. In this regard we also got some
really interesting results. It turns out that two GTX 660 cards are 25
percent faster on average then one GTX 680 Furthermore the scaling was
good too: on average 64 percent. Considering that two GTX 660's are
cheaper than one GTX 680, this cheap little card just got even more
interesting. |
|
- Performance
- 63 % faster than the
GTX 460
- Only 5 % slower than the
GTX 580
- Up to 200 % performance improvement in SLI |
|
| |
|
|
|
|
Recommendation |
|
+
|
- |
| So in the end
the GeForce GTX 660 graphics card from nVidia powered by the GK106 is
here to fight with the Radeon HD 7870/7850 from AMD. With
almost the same performance/price and power consumption as the HD 7870, both nVidia and AMD have very powerful cards for in the 180 Euros
range. Gamers will be really happy about this. |
|
- Gaming |
|
Discuss this article in the
forums
 Article in English
  Artikel in Deutsch
 Article
en français
Article
en français