 The GTX 680 DirectCU II Top from ASUS is one of the best equipped GTX 680 around. The GPU clock has been pushed up to 1'202 MHz, the PCB has been entirely revisited and it's beeing cooled by a huge triple slot dual fan cooler. ASUS claims his flagship to be 11 % faster, 20 % cooler and 14dB quieter than the reference design.
 Article in English
 |
 Artikel in Deutsch
 |
 Article en français
 |
 Articolo in italiano
 |

On the following pages we will show you the strenghts and weaknesses of the ASUS GeForce GTX 680 DirectCU II Top.
Discuss this article in the forums [pagebreak]
Technical data / Specifications
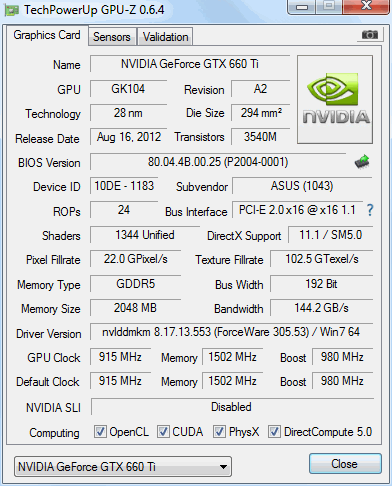
With the ASUS GeForce GTX 680 DirectCU II Top you get a factory overclocked card with a custom PCB design cooled by a huge triple slot cooler. The ASIC quality measured on our sample was 81.9 %.That's the highest we have seen on our GTX 680s.
About ASIC quality:

Looking at clock speeds we see that the GPU runs at 1'137 MHz with a typical boost of 1'202 MHz. In comparison, the stock designed GTX 680 runs at 1'006 MHz with a typical boost of 1'058 MHz. Like most of the GTX 680 out there no factory overclocking has been made regarding the GDDR5 memory which stays clocked at 1'500 MHz (6'000 MHz effective) following nVidia's recommendations.
As surprising as it may sound our card was always running at a fixed frequency of 1'202 MHz under load. Like there was no boost and the default clock speed was 1'202 MHz just like our TGT BEAST LLS that was always working at a fixed clock of 1'241 MHz. We like it!

| TGT GTX 680 BEAST LLS | ASUS GTX 680 DCU II Top | EVGA GTX 680 SuperClocked | MSI GTX 680 Twin Frozr OC | GeForce GTX 680 | |
| Chip | GK104 | GK104 | GK104 | GK104 | GK104 |
| Process | 28 nm | 28 nm | 28 nm | 28 nm | 28 nm |
| Transistors | 3.54 billion | 3.54 billion | 3.54 Billion | 3.54 billion | 3.54 Billion |
| GPU clock | 1'163 MHz (Boost 1'229 MHz) | 1'202 MHz | 1'058 MHz (Boost 1'124 MHz) | 1'059 MHz (Boost 1'124 MHz) | 1'006 MHz (Boost 1'058 MHz) |
| Memory | 2'048 MB GDDR5 | 2'048 MB GDDR5 | 2'048 MB GDDR5 | 2'048 MB GDDR5 | 2'048 MB GDDR5 |
| Memory clock | 1'500 MHz (6'000 MHz) | 1'500 MHz (6'000 MHz) | 1'550 MHz (6'200 MHz) | 1'500 MHz (6'000 MHz) | 1'500 MHz (6'000 MHz) |
| Memory interface | 256 Bit | 256 Bit | 256 Bit | 256 Bit | 256 Bit |
| Memory bandwidth | 192'400 MB/s | 192'400 MB/s | 192'400 MB/s | 192'400 MB/s | 192'400 MB/s |
| TMUs | 128 | 128 | 128 | 128 | 128 |
| Shader Cores | 1'536 (8 SMX) | 1'536 (8 SMX) | 1'536 (8 SMX) | 1'536 (8 SMX) | 1'536 (8 SMX) |
| ROPs | 32 ROP | 32 ROP | 32 ROP | 32 ROP | 32 ROP |
| Shader model | SM 5 | SM 5 | SM 5 | SM 5 | SM 5 |
| Maximum board power | xxx Watt | xxx Watt | 185 Watt | 195 Watt | 185 Watt |
Looking at the card itself, the ASUS GTX 680 DirectCU II Top is the same card as the DirectCU II and DirectCU II OC version from the same manufacturer. The PCB is completely different compared to the reference design, ASUS reworked everything from the circuit to the power design. Therefore you get a 10-phase Super Alloy Power design where the GPU gets eight phases and the memory gets two phases. For the GPU, that's twice as much as what the reference design card offers.
The voltage regulation chip used is labeled "DIGI+ VRM" and is in fact a rebranded CHiL 8318.

ASUS' graphics card also features a backplate and a small cooler that covers and cools down the VRM stage. The backplate is made of metal and protects the back of the card against physical damage.

The cooler that keeps this card at adequate temperatures is called DirectCU II. This one is the triple slot version and is equiped with five copper heatpipes in direct contact with the core and a lot of aluminium fins. The two fans have a diameter of 10cm and are 14dB quieter than the reference card's blower according to the manufacturer. Still according to the manufacturer their GTX 680 DirectCU II is 20 % cooler than the reference card. ASUS chose to attach the cooler with four screws to the card. We tried to move the cooler from right to left, even applying force didn't help moving it, which is a good sign. Also the pressure on the graphics core is very good.

The memory chips used are made by Hynix and carry the model number H5GQ2H24MFR-R0C. They are specified to run at 1'500 MHz (6'000 MHz effective).

Discuss this article in the forums [pagebreak]
Preview


Delivery

Bundled with the graphics card you find a manual, a driver CD, a long SLI bridge and a dual Molex to PCIe power cable. The card ships well bolstered, that it's almost impossible that something will be damaged during transportation.
Discuss this article in the forums [pagebreak]
Test Setup
Hardware
| Mainboard |
|
| CPUs |
|
| Memory |
|
| Graphic Cards (Driver) |
|
| HDD |
|
| PSU |
|

Discuss this article in the forums [pagebreak]
3DMark 11

| 3DMark 11 GPU | Score | GPU-Z | Review | Gallery |
| TGT GeForce GTX 680 BEAST LLS 1'241 (FW 310.70) | 11'364 |
 |
 |
 |
| ASUS GeForce GTX 680 DCU II Top 1'201 MHz (FW 310.70) | 10'732 |
|
||
| EVGA GeForce GTX 680 SC Signature2 (Turbo up to 1'201 MHz) (FW 310.70) | 10'717 |
 |
|
|
| AMD Radeon HD 6990 (Catalyst 12.3) | 10'694 |
 |
|
|
| EVGA GeForce GTX 680 SC (Turbo up to 1'215 MHz) (FW 310.70) | 10'442 |
 |
|
|
| MSI GeForce GTX 680 TF OC (Turbo up to 1'163 MHz) (FW 310.70) | 10'282 |
 |
|
|
| nVidia GeForce GTX 680 Boost Max 1'059 MHz (FW 310.70) | 9'937 |
 |
|
|
| AMD Radeon HD 7970 (XFX Double Dissipation) (Catalyst 12.11B8) | 8'879 |
 |
|
|
| nVidia GeForce GTX 670 Boost Max 980 MHz (FW 310.70) | 8'088 |
 |
|
|
| nVidia GeForce GTX 660 Ti Boost Max 980 MHz (FW 310.70) | 7'524 |
 |
||
| AMD Radeon HD 7950 (Catalyst 12.11B8) | 7'461 |
 |
||
| AMD Radeon HD 7870 (Catalyst 12.11B8) | 6'914 |
 |
||
| nVidia GeForce GTX 660 Boost Max 1'033 MHz (FW 310.70) | 6'290 |
 |
|
|
| nVidia GeForce GTX 580 (FW 296.10) | 5'945 |
 |
||
| AMD Radeon HD 7850 (Catalyst 12.11B8) | 5'646 |
 |
||
| nVidia GeForce GTX 570 (FW 296.10) | 5'223 |
 |
||
| ASUS GeForce GTX 560 Ti 448 Cores DCU II (FW 296.10) | 4'976 |
 |
|
|
| AMD Radeon HD 6950 2GB (ASUS) (Catalyst 12.3) | 4'777 |
 |
|
|
| nVidia GeForce GTX 650 Ti 1GB (FW 310.70) | 4'511 |
 |
||
| nVidia GeForce GTX 560 Ti 1GB (FW 296.10) | 4'148 |
 |
||
| AMD Radeon HD 6870 (Catalyst 12.3) | 4'036 |
 |
||
| AMD Radeon HD 6850 (Catalyst 12.3) | 3'326 |
 |
||
| AMD Radeon HD 6770 (ASUS DCU Silent) (Catalyst 12.3) | 2'437 |
 |
|
|
| AMD Radeon HD 7750 (Club3D Royal Queen) (Catalyst 12.4) | 2'386 |
 |
|
|
| nVidia GeForce GTX 550 Ti (FW 296.10) | 2'335 |
 |
||
| AMD Radeon HD 6670 1GB GDDR5 (Catalyst 12.3) | 1'620 |
 |
||
| AMD Radeon HD 6570 GDDR5 (Catalyst 12.3) | 1'366 |
 |
||
| More is better | ||||

Discuss this article in the forums [pagebreak]
3DMark Vantage

| 3DMark Vantage GPU | Score | GPU-Z | Review | Gallery |
| TGT GeForce GTX 680 BEAST LLS 1'241 (FW 310.70) | 35'601 |
|
|
|
| ASUS GeForce GTX 680 DCU II Top 1'201 MHz (FW 310.70) | 34'782 |
|
||
| EVGA GeForce GTX 680 SC Signature2 (Turbo up to 1'201 MHz) (FW 310.70) | 34'745 |
|
|
|
| AMD Radeon HD 6990 (Catalyst 12.3) | 34'635 |
|
|
|
| EVGA GeForce GTX 680 SC (Turbo up to 1'215 MHz) (FW 310.70) | 33'854 |
|
|
|
| MSI GeForce GTX 680 TF OC (Turbo up to 1'163 MHz) (FW 310.70) | 33'823 |
|
|
|
| nVidia GeForce GTX 680 Boost Max 1'059 MHz (FW 310.70) | 33'549 |
|
|
|
| AMD Radeon HD 7970 (XFX Double Dissipation) (Catalyst 12.11B8) | 32'455 |
|
|
|
| nVidia GeForce GTX 670 Boost Max 980 MHz (FW 310.70) | 29'732 |
|
|
|
| AMD Radeon HD 7950 (Catalyst 12.11B8) | 28'584 |
|
||
| nVidia GeForce GTX 660 Ti Boost Max 980 MHz (FW 310.70) | 26'960 |
|
||
| AMD Radeon HD 7870 (Catalyst 12.11B8) | 25'986 |
|
||
| nVidia GeForce GTX 580 (FW 296.10) | 25'394 |
|
||
| nVidia GeForce GTX 660 Boost Max 1'033 MHz (FW 310.70) | 24'322 |
|
|
|
| nVidia GeForce GTX 570 (FW 296.10) | 22'130 |
|
||
| ASUS GeForce GTX 560 Ti 448 Cores DCU II (FW 296.10) | 21'386 |
|
|
|
| AMD Radeon HD 7850 (Catalyst 12.11B8) | 21'552 |
|
||
| AMD Radeon HD 6950 2GB (ASUS) (Catalyst 12.3) | 19'571 |
|
|
|
| nVidia GeForce GTX 560 Ti 1GB (FW 296.10) | 18'304 |
|
||
| nVidia GeForce GTX 650 Ti 1GB (FW 310.70) | 17'053 |
|
||
| AMD Radeon HD 6870 (Catalyst 12.3) | 16'829 |
|
||
| AMD Radeon HD 6850 (Catalyst 12.3) | 13'337 |
|
||
| nVidia GeForce GTX 550 Ti (FW 296.10) | 10'197 |
|
||
| AMD Radeon HD 7750 (Club3D Royal Queen) (Catalyst 12.4) | 10'040 |
|
|
|
| AMD Radeon HD 6770 (ASUS DCU Silent) (Catalyst 12.3) | 9'641 |
|
|
|
| AMD Radeon HD 6670 1GB GDDR5 (Catalyst 12.3) | 7'150 |
|
||
| AMD Radeon HD 6570 GDDR5 (Catalyst 12.3) | 6'067 |
|
||
| More is better | ||||

Discuss this article in the forums [pagebreak]
Unigine Heaven

| Unigine Heaven DX11 Benchmark | Score | GPU-Z | Review | Gallery |
| AMD Radeon HD 6990 (Catalyst 12.3) | 1'300 |
|
|
|
| EVGA GeForce GTX 680 SC (Turbo up to 1'215 MHz) (FW 310.70) | 1'271 |
|
|
|
| TGT GeForce GTX 680 BEAST LLS 1'241 (FW 310.70) | 1'260 |
|
|
|
| EVGA GeForce GTX 680 SC Signature2 (Turbo up to 1'201 MHz) (FW 310.70) | 1'250 |
|
|
|
| ASUS GeForce GTX 680 DCU II Top 1'201 MHz (FW 310.70) | 1'238 |
|
||
| MSI GeForce GTX 680 TF OC (Turbo up to 1'163 MHz) (FW 310.70) | 1'214 |
|
|
|
| nVidia GeForce GTX 680 Boost Max 1'059 MHz (FW 310.70) | 1'186 |
|
|
|
| AMD Radeon HD 7970 (XFX Double Dissipation) (Catalyst 12.11B8) | 1'068 |
|
|
|
| nVidia GeForce GTX 670 Boost Max 980 MHz (FW 310.70) | 1'052 |
|
|
|
| AMD Radeon HD 7870 (Catalyst 12.11B8) | 912 |
|
||
| AMD Radeon HD 7950 (Catalyst 12.11B8) | 902 |
|
||
| nVidia GeForce GTX 660 Ti Boost Max 980 MHz (FW 310.70) | 870 |
|
||
| nVidia GeForce GTX 580 (FW 296.10) | 862 |
|
||
| nVidia GeForce GTX 660 Boost Max 1'033 MHz (FW 310.70) | 801 |
|
|
|
| AMD Radeon HD 7850 (Catalyst 12.11B8) | 752 |
|
||
| nVidia GeForce GTX 570 (FW 296.10) | 728 |
|
||
| ASUS GeForce GTX 560 Ti 448 Cores DCU II (FW 296.10) | 699 |
|
|
|
| AMD Radeon HD 6950 2GB (ASUS) (Catalyst 12.3) | 596 |
|
|
|
| nVidia GeForce GTX 560 Ti 1GB (FW 296.10) | 591 |
|
||
| AMD Radeon HD 6870 (Catalyst 12.3) | 531 |
|
||
| nVidia GeForce GTX 650 Ti 1GB (FW 310.70) | 527 |
|
||
| AMD Radeon HD 6850 (Catalyst 12.3) | 438 |
|
||
| AMD Radeon HD 7750 (Club3D Royal Queen) (Catalyst 12.4) | 369 |
|
|
|
| nVidia GeForce GTX 550 Ti (FW 296.10) | 332 |
|
||
| AMD Radeon HD 6770 (ASUS DCU Silent) (Catalyst 12.3) | 304 |
|
|
|
| AMD Radeon HD 6670 1GB GDDR5 (Catalyst 12.3) | 233 |
|
||
| AMD Radeon HD 6570 GDDR5 (Catalyst 12.3) | 141 |
|
||
| More is better | ||||

Discuss this article in the forums [pagebreak]
TessMark

| Geeks3D TessMark | Score | GPU-Z | Review | Gallery |
| TGT GeForce GTX 680 BEAST LLS 1'241 (FW 310.70) | 6'889 |
|
|
|
| ASUS GeForce GTX 680 DCU II Top 1'201 MHz (FW 310.70) | 6'623 |
|
||
| EVGA GeForce GTX 680 SC Signature2 (Turbo up to 1'201 MHz) (FW 310.70) | 6'578 |
|
|
|
| EVGA GeForce GTX 680 SC (Turbo up to 1'215 MHz) (FW 310.70) | 6'289 |
|
|
|
| MSI GeForce GTX 680 TF OC (Turbo up to 1'163 MHz) (FW 310.70) | 6'200 |
|
|
|
| nVidia GeForce GTX 680 Boost Max 1'059 MHz (FW 310.70) | 5'981 |
|
|
|
| nVidia GeForce GTX 670 Boost Max 980 MHz (FW 310.70) | 4'827 |
|
|
|
| nVidia GeForce GTX 660 Ti Boost Max 980 MHz (FW 310.70) | 4'379 |
|
||
| nVidia GeForce GTX 660 Boost Max 1'033 MHz (FW 310.70) | 3'885 |
|
|
|
| nVidia GeForce GTX 580 (FW 296.10) | 3'697 |
|
||
| AMD Radeon HD 7970 (XFX Double Dissipation) (Catalyst 12.11B8) | 3'246 |
|
|
|
| nVidia GeForce GTX 570 (FW 296.10) | 3'206 |
|
||
| AMD Radeon HD 7870 (Catalyst 12.11B8) | 3'159 |
|
||
| ASUS GeForce GTX 560 Ti 448 Cores DCU II (FW 296.10) | 3'031 |
|
|
|
| nVidia GeForce GTX 650 Ti 1GB (FW 310.70) | 2'854 |
|
||
| AMD Radeon HD 7950 (Catalyst 12.11B8) | 2'802 |
|
||
| nVidia GeForce GTX 560 Ti 1GB (FW 296.10) | 2'177 |
|
||
| AMD Radeon HD 6990 (Catalyst 12.3) | 1'930 |
|
|
|
| AMD Radeon HD 7850 (Catalyst 12.11B8) | 1'907 |
|
||
| nVidia GeForce GTX 550 Ti (FW 296.10) | 1'212 |
|
||
| AMD Radeon HD 7750 (Club3D Royal Queen) (Catalyst 12.4) | 929 |
|
|
|
| AMD Radeon HD 6950 2GB (ASUS) (Catalyst 12.3) | 884 |
|
|
|
| AMD Radeon HD 6870 (Catalyst 12.3) | 678 |
|
||
| AMD Radeon HD 6850 (Catalyst 12.3) | 580 |
|
||
| AMD Radeon HD 6770 (ASUS DCU Silent) (Catalyst 12.3) | 566 |
|
|
|
| AMD Radeon HD 6670 1GB GDDR5 (Catalyst 12.3) | 474 |
|
||
| AMD Radeon HD 6570 GDDR5 (Catalyst 12.3) | 386 |
|
||
| More is better | ||||

Discuss this article in the forums [pagebreak]
Alien vs Predator

| Alien vs Predator DX11 Benchmark | Average |
GPU-Z
|
Review | Gallery |
| AMD Radeon HD 6990 (Catalyst 12.3) | 96.9 fps |
|
|
|
| AMD Radeon HD 7970 (XFX Double Dissipation) (Catalyst 12.11B8) | 71.1 fps |
|
|
|
| EVGA GeForce GTX 680 SC (Turbo up to 1'215 MHz) (FW 310.70) | 61.7 fps |
|
|
|
| EVGA GeForce GTX 680 SC Signature2 (Turbo up to 1'201 MHz) (FW 310.70) | 61.6 fps |
|
|
|
| TGT GeForce GTX 680 BEAST LLS 1'241 (FW 310.70) | 60.5 fps |
|
|
|
| ASUS GeForce GTX 680 DCU II Top 1'201 MHz (FW 310.70) | 60.25 fps |
|
||
| MSI GeForce GTX 680 TF OC (Turbo up to 1'163 MHz) (FW 310.70) | 59.6 fps |
|
|
|
| AMD Radeon HD 7950 (Catalyst 12.11B8) | 59.6 fps |
|
||
| nVidia GeForce GTX 680 Boost Max 1'059 MHz (FW 310.70) | 58.9 fps |
|
|
|
| nVidia GeForce GTX 670 Boost Max 980 MHz (FW 310.70) | 55.2 fps |
|
|
|
| AMD Radeon HD 7870 (Catalyst 12.11B8) | 49.9 fps |
|
||
| nVidia GeForce GTX 580 (FW 296.10) | 46.8 fps |
|
||
| AMD Radeon HD 6950 2GB (ASUS) (Catalyst 12.3) | 43.5 fps |
|
|
|
| nVidia GeForce GTX 660 Ti Boost Max 980 MHz (FW 310.70) | 43.4 fps |
|
||
| nVidia GeForce GTX 660 Boost Max 1'033 MHz (FW 310.70) | 42.3 fps |
|
|
|
| AMD Radeon HD 7850 (Catalyst 12.11B8) | 41.3 fps |
|
||
| nVidia GeForce GTX 570 (FW 296.10) | 39.5 fps |
|
||
| ASUS GeForce GTX 560 Ti 448 Cores DCU II (FW 296.10) | 38.3 fps |
|
|
|
| AMD Radeon HD 6870 (Catalyst 12.3) | 36.8 fps |
|
||
| nVidia GeForce GTX 560 Ti 1GB (FW 296.10) | 32.9 fps |
|
||
| AMD Radeon HD 6850 (Catalyst 12.3) | 30.0 fps |
|
||
| nVidia GeForce GTX 650 Ti 1GB (FW 310.70) | 27.0 fps |
|
||
| AMD Radeon HD 6770 (ASUS DCU Silent) (Catalyst 12.3) | 21.4 fps |
|
|
|
| nVidia GeForce GTX 550 Ti (FW 296.10) | 20.2 fps |
|
||
| AMD Radeon HD 7750 (Club3D Royal Queen) (Catalyst 12.4) | 17.5 fps |
|
|
|
| AMD Radeon HD 6670 1GB GDDR5 (Catalyst 12.3) | 15.4 fps |
|
||
| AMD Radeon HD 6570 GDDR5 (Catalyst 12.3) | 12.7 fps |
|
||
| More is better | ||||

Discuss this article in the forums [pagebreak]
Batman: Arkham City

| Batman: Arkham City Integrated Benchmark | Average | GPU-Z | Review | Gallery |
| AMD Radeon HD 7970 (XFX Double Dissipation) (Catalyst 12.11B8) | 88 fps |
|
|
|
| EVGA GeForce GTX 680 SC (Turbo up to 1'215 MHz) (FW 310.70) | 83 fps |
|
|
|
| EVGA GeForce GTX 680 SC Signature2 (Turbo up to 1'201 MHz) (FW 310.70) | 83 fps |
|
|
|
| TGT GeForce GTX 680 BEAST LLS 1'241 (FW 310.70) | 82 fps |
|
|
|
| ASUS GeForce GTX 680 DCU II Top 1'201 MHz (FW 310.70) | 81 fps |
|
||
| MSI GeForce GTX 680 TF OC (Turbo up to 1'163 MHz) (FW 310.70) | 80 fps |
|
|
|
| nVidia GeForce GTX 680 Boost Max 1'059 MHz (FW 310.70) | 80 fps |
|
|
|
| nVidia GeForce GTX 670 Boost Max 980 MHz (FW 310.70) | 76 fps |
|
|
|
| AMD Radeon HD 7950 (Catalyst 12.11B8) | 74 fps |
|
||
| AMD Radeon HD 7870 (Catalyst 12.11B8) | 66 fps |
|
||
| nVidia GeForce GTX 660 Ti Boost Max 980 MHz (FW 310.70) | 60 fps |
|
||
| nVidia GeForce GTX 660 Boost Max 1'033 MHz (FW 310.70) | 60 fps |
|
|
|
| AMD Radeon HD 7850 (Catalyst 12.11B8) | 59 fps |
|
||
| nVidia GeForce GTX 580 (FW 296.10) | 54 fps |
|
||
| AMD Radeon HD 6990 (Catalyst 12.3) | 51 fps |
|
|
|
| nVidia GeForce GTX 570 (FW 296.10) | 46 fps |
|
||
| ASUS GeForce GTX 560 Ti 448 Cores DCU II (FW 296.10) | 43 fps |
|
|
|
| AMD Radeon HD 6950 2GB (ASUS) (Catalyst 12.3) | 42 fps |
|
|
|
| nVidia GeForce GTX 560 Ti 1GB (FW 296.10) | 40 fps |
|
||
| AMD Radeon HD 6870 (Catalyst 12.3) | 38 fps |
|
||
| nVidia GeForce GTX 650 Ti 1GB (FW 310.70) | 38 fps |
|
||
| AMD Radeon HD 6850 (Catalyst 12.3) | 32 fps |
|
||
| AMD Radeon HD 7750 (Club3D Royal Queen) (Catalyst 12.4) | 25 fps |
|
|
|
| nVidia GeForce GTX 550 Ti (FW 296.10) | 24 fps |
|
||
| AMD Radeon HD 6770 (ASUS DCU Silent) (Catalyst 12.3) | 21 fps |
|
|
|
| AMD Radeon HD 6670 1GB GDDR5 (Catalyst 12.3) | 14 fps |
|
||
| AMD Radeon HD 6570 GDDR5 (Catalyst 12.3) | 11 fps |
|
||
| More is better | ||||

Discuss this article in the forums [pagebreak]
DIRT 2

| DIRT 2 Integrated Benchmark | Average | GPU-Z | Review | Gallery |
| AMD Radeon HD 6990 (Catalyst 12.3) | 149.3 fps |
|
|
|
| EVGA GeForce GTX 680 SC Signature2 (Turbo up to 1'201 MHz) (FW 310.70) | 138.0 fps |
|
|
|
| EVGA GeForce GTX 680 SC (Turbo up to 1'215 MHz) (FW 310.70) | 137.3 fps |
|
|
|
| TGT GeForce GTX 680 BEAST LLS 1'241 (FW 310.70) | 136.3 fps |
|
|
|
| ASUS GeForce GTX 680 DCU II Top 1'201 MHz (FW 310.70) | 136.1 fps |
|
||
| MSI GeForce GTX 680 TF OC (Turbo up to 1'163 MHz) (FW 310.70) | 136.0 fps |
|
|
|
| nVidia GeForce GTX 680 Boost Max 1'059 MHz (FW 310.70) | 134.4 fps |
|
|
|
| AMD Radeon HD 7970 (XFX Double Dissipation) (Catalyst 12.11B8) | 125.5 fps |
|
|
|
| nVidia GeForce GTX 670 Boost Max 980 MHz (FW 310.70) | 125.0 fps |
|
|
|
| AMD Radeon HD 7950 (Catalyst 12.11B8) | 109.6 fps |
|
||
| nVidia GeForce GTX 580 (FW 296.10) | 107.7 fps |
|
||
| AMD Radeon HD 7870 (Catalyst 12.11B8) | 102.8 fps |
|
||
| nVidia GeForce GTX 660 Boost Max 1'033 MHz (FW 310.70) | 101.9 fps |
|
|
|
| nVidia GeForce GTX 660 Ti Boost Max 980 MHz (FW 310.70) | 100.7 fps |
|
||
| nVidia GeForce GTX 570 (FW 296.10) | 92.7 fps |
|
||
| ASUS GeForce GTX 560 Ti 448 Cores DCU II (FW 296.10) | 90.1 fps |
|
|
|
| AMD Radeon HD 7850 (Catalyst 12.11B8) | 88.3 fps |
|
||
| AMD Radeon HD 6950 2GB (ASUS) (Catalyst 12.3) | 80.9 fps |
|
|
|
| nVidia GeForce GTX 560 Ti 1GB (FW 296.10) | 78.6 fps |
|
||
| AMD Radeon HD 6870 (Catalyst 12.3) | 71.9 fps |
|
||
| nVidia GeForce GTX 650 Ti 1GB (FW 310.70) | 65.7 fps |
|
||
| AMD Radeon HD 6850 (Catalyst 12.3) | 62.4 fps |
|
||
| nVidia GeForce GTX 550 Ti (FW 296.10) | 48.5 fps |
|
||
| AMD Radeon HD 7750 (Club3D Royal Queen) (Catalyst 12.4) | 45.1 fps |
|
|
|
| AMD Radeon HD 6770 (ASUS DCU Silent) (Catalyst 12.3) | 42.6 fps |
|
|
|
| AMD Radeon HD 6670 1GB GDDR5 (Catalyst 12.3) | 32.1 fps |
|
||
| AMD Radeon HD 6570 GDDR5 (Catalyst 12.3) (AA 4x) | 29.6 fps |
|
||
| More is better | ||||

Discuss this article in the forums [pagebreak]
Call Of Duty Modern Warfare 3

| Call Of Duty Modern Warfare 3 (5 Minutes GamePlay) | Average | GPU-Z | Review | Gallery |
| AMD Radeon HD 6990 (Catalyst 12.3) | 195.10 fps |
|
|
|
| EVGA GeForce GTX 680 SC Signature2 (Turbo up to 1'201 MHz) (FW 310.70) | 188.80 fps |
|
|
|
| TGT GeForce GTX 680 BEAST LLS 1'241 (FW 310.70) | 186.35 fps |
|
|
|
| EVGA GeForce GTX 680 SC (Turbo up to 1'215 MHz) (FW 310.70) | 180.80 fps |
|
|
|
| ASUS GeForce GTX 680 DCU II Top 1'201 MHz (FW 310.70) | 177.96 fps |
|
||
| MSI GeForce GTX 680 TF OC (Turbo up to 1'163 MHz) (FW 310.70) | 175.13 fps |
|
|
|
| nVidia GeForce GTX 680 Boost Max 1'059 MHz (FW 310.70) | 170.38 fps |
|
|
|
| AMD Radeon HD 7970 (XFX Double Dissipation) (Catalyst 12.11B8) | 167.58 fps |
|
|
|
| nVidia GeForce GTX 670 Boost Max 980 MHz (FW 310.70) | 166.85 fps |
|
|
|
| nVidia GeForce GTX 660 Ti Boost Max 980 MHz (FW 310.70) | 164.22 fps |
|
||
| nVidia GeForce GTX 660 Boost Max 1'033 MHz (FW 310.70) | 152.09 fps |
|
|
|
| AMD Radeon HD 7950 (Catalyst 12.11B8) | 149.64 fps |
|
||
| AMD Radeon HD 7870 (Catalyst 12.11B8) | 138.30 fps |
|
||
| nVidia GeForce GTX 580 (FW 296.10) | 126.58 fps |
|
||
| AMD Radeon HD 7850 (Catalyst 12.11B8) | 125.12 fps |
|
||
| nVidia GeForce GTX 570 (FW 296.10) | 117.83 fps |
|
||
| nVidia GeForce GTX 650 Ti 1GB (FW 310.70) | 109.67 fps |
|
||
| ASUS GeForce GTX 560 Ti 448 Cores DCU II (FW 296.10) | 109.33 fps |
|
|
|
| AMD Radeon HD 6950 2GB (ASUS) (Catalyst 12.3) | 109.30 fps |
|
|
|
| nVidia GeForce GTX 560 Ti 1GB (FW 296.10) | 104.20 fps |
|
||
| AMD Radeon HD 6870 (Catalyst 12.3) | 100.05 fps |
|
||
| AMD Radeon HD 6850 (Catalyst 12.3) | 89.04 fps |
|
||
| nVidia GeForce GTX 550 Ti (FW 296.10) | 69.28 fps |
|
||
| AMD Radeon HD 6770 (ASUS DCU Silent) (Catalyst 12.3) | 64.53 fps |
|
|
|
| AMD Radeon HD 7750 (Club3D Royal Queen) (Catalyst 12.4) | 62.95 fps |
|
|
|
| AMD Radeon HD 6670 1GB GDDR5 (Catalyst 12.3) | 48.98 fps |
|
||
| AMD Radeon HD 6570 GDDR5 (Catalyst 12.3) | 39.78 fps |
|
||
| More is better | ||||

Discuss this article in the forums [pagebreak]
BattleField 3

| BattleField 3 (5 Minutes GamePlay) | Average | GPU-Z | Review | Gallery |
| EVGA GeForce GTX 680 SC (Turbo up to 1'215 MHz) (FW 310.70) | 69.97 fps |
|
|
|
| AMD Radeon HD 7970 (XFX Double Dissipation) (Catalyst 12.11B8) | 69.67 fps |
|
|
|
| EVGA GeForce GTX 680 SC Signature2 (Turbo up to 1'201 MHz) (FW 310.70) | 69.47 fps |
|
|
|
| TGT GeForce GTX 680 BEAST LLS 1'241 (FW 310.70) | 68.53 fps |
|
|
|
| MSI GeForce GTX 680 TF OC (Turbo up to 1'163 MHz) (FW 310.70) | 68.32 fps |
|
|
|
| ASUS GeForce GTX 680 DCU II Top 1'201 MHz (FW 310.70) | 67.62 fps |
|
||
| nVidia GeForce GTX 680 Boost Max 1'059 MHz (FW 310.70) | 66.10 fps |
|
|
|
| AMD Radeon HD 6990 (Catalyst 12.3) | 65.30 fps |
|
|
|
| AMD Radeon HD 7950 (Catalyst 12.11B8) | 60.00 fps |
|
||
| AMD Radeon HD 7870 (Catalyst 12.11B8) | 59.62 fps |
|
||
| nVidia GeForce GTX 670 Boost Max 980 MHz (FW 310.70) | 57.45 fps |
|
|
|
| nVidia GeForce GTX 660 Ti Boost Max 980 MHz (FW 310.70) | 51.02 fps |
|
||
| AMD Radeon HD 7850 (Catalyst 12.11B8) | 48.74 fps |
|
||
| nVidia GeForce GTX 660 Boost Max 1'033 MHz (FW 310.70) | 47.18 fps |
|
|
|
| nVidia GeForce GTX 580 (FW 296.10) | 43.10 fps |
|
||
| nVidia GeForce GTX 570 (FW 296.10) | 39.58 fps |
|
||
| ASUS GeForce GTX 560 Ti 448 Cores DCU II (FW 296.10) | 37.98 fps |
|
|
|
| nVidia GeForce GTX 560 Ti 1GB (FW 296.10) | 33.75 fps |
|
||
| nVidia GeForce GTX 650 Ti 1GB (FW 310.70) | 33.61 fps |
|
||
| AMD Radeon HD 6950 2GB (ASUS) (Catalyst 12.3) | 30.93 fps |
|
|
|
| AMD Radeon HD 6870 (Catalyst 12.3) | 28.95 fps |
|
||
| AMD Radeon HD 6850 (Catalyst 12.3) | 24.19 fps |
|
||
| nVidia GeForce GTX 550 Ti (FW 296.10) | 20.73 fps |
|
||
| AMD Radeon HD 7750 (Club3D Royal Queen) (Catalyst 12.4) | 18.90 fps |
|
|
|
| AMD Radeon HD 6770 (ASUS DCU Silent) (Catalyst 12.3) | 18.58 fps |
|
|
|
| AMD Radeon HD 6670 1GB GDDR5 (Catalyst 12.3) | 13.07 fps |
|
||
| AMD Radeon HD 6570 GDDR5 (Catalyst 12.3) | 9.35 fps |
|
||
| More is better | ||||


Discuss this article in the forums [pagebreak]
Crysis 2

| Crysis 2 DX11 + HiRes Texture Pack Benchmark | Average | GPU-Z | Review | Gallery |
| EVGA GeForce GTX 680 SC Signature2 (Turbo up to 1'201 MHz) (FW 310.70) | 73.9 fps |
|
|
|
| TGT GeForce GTX 680 BEAST LLS 1'241 (FW 310.70) | 73.6 fps |
|
|
|
| ASUS GeForce GTX 680 DCU II Top 1'201 MHz (FW 310.70) | 73.2 fps |
|
||
| EVGA GeForce GTX 680 SC (Turbo up to 1'215 MHz) (FW 310.70) | 73.2 fps |
|
|
|
| MSI GeForce GTX 680 TF OC (Turbo up to 1'163 MHz) (FW 310.70) | 71.8 fps |
|
|
|
| nVidia GeForce GTX 680 Boost Max 1'059 MHz (FW 310.70) | 70.1 fps |
|
|
|
| nVidia GeForce GTX 670 Boost Max 980 MHz (FW 310.70) | 61.1 fps |
|
|
|
| AMD Radeon HD 7970 (XFX Double Dissipation) (Catalyst 12.11B8) | 59.9 fps |
|
|
|
| AMD Radeon HD 6990 (Catalyst 12.3) | 57.0 fps |
|
|
|
| nVidia GeForce GTX 660 Ti Boost Max 980 MHz (FW 310.70) | 51.8 fps |
|
||
| nVidia GeForce GTX 580 (FW 296.10) | 47.5 fps |
|
||
| nVidia GeForce GTX 660 Boost Max 1'033 MHz (FW 310.70) | 46.3 fps |
|
|
|
| AMD Radeon HD 7950 (Catalyst 12.11B8) | 50.1 fps |
|
||
| AMD Radeon HD 7870 (Catalyst 12.11B8) | 47.6 fps |
|
||
| nVidia GeForce GTX 570 (FW 296.10) | 40.9 fps |
|
||
| AMD Radeon HD 7850 (Catalyst 12.11B8) | 39.9 fps |
|
||
| ASUS GeForce GTX 560 Ti 448 Cores DCU II (FW 296.10) | 39.3 fps |
|
|
|
| nVidia GeForce GTX 560 Ti 1GB (FW 296.10) | 33.1 fps |
|
||
| nVidia GeForce GTX 650 Ti 1GB (FW 310.70) | 31.5 fps |
|
||
| AMD Radeon HD 6950 2GB (ASUS) (Catalyst 12.3) | 27.4 fps |
|
|
|
| AMD Radeon HD 6870 (Catalyst 12.3) | 26.5 fps |
|
||
| AMD Radeon HD 6850 (Catalyst 12.3) | 22.1 fps |
|
||
| AMD Radeon HD 7750 (Club3D Royal Queen) (Catalyst 12.4) | 19.5 fps |
|
|
|
| nVidia GeForce GTX 550 Ti (FW 296.10) | 18.9 fps |
|
||
| AMD Radeon HD 6770 (ASUS DCU Silent) (Catalyst 12.3) | 15.8 fps |
|
|
|
| AMD Radeon HD 6670 1GB GDDR5 (Catalyst 12.3) | 11.8 fps |
|
||
| AMD Radeon HD 6570 GDDR5 (Catalyst 12.3) | 9.6 fps |
|
||
| More is better | ||||

Discuss this article in the forums [pagebreak]
Dragon Age 2

| Dragon Age II (5 Minutes GamePlay) | Average | GPU-Z | Review | Gallery |
| AMD Radeon HD 6990 (Catalyst 12.3) | 76.95 fps |
|
|
|
| EVGA GeForce GTX 680 SC Signature2 (Turbo up to 1'201 MHz) (FW 310.70) | 65.34 fps |
|
|
|
| EVGA GeForce GTX 680 SC (Turbo up to 1'215 MHz) (FW 310.70) | 65.14 fps |
|
|
|
| TGT GeForce GTX 680 BEAST LLS 1'241 (FW 310.70) | 63.47 fps |
|
|
|
| MSI GeForce GTX 680 TF OC (Turbo up to 1'163 MHz) (FW 310.70) | 62.95 fps |
|
|
|
| ASUS GeForce GTX 680 DCU II Top 1'201 MHz (FW 310.70) | 62.30 fps |
|
||
| nVidia GeForce GTX 680 Boost Max 1'059 MHz (FW 310.70) | 60.55 fps |
|
|
|
| AMD Radeon HD 7970 (XFX Double Dissipation) (Catalyst 12.11B8) | 51.27 fps |
|
|
|
| nVidia GeForce GTX 670 Boost Max 980 MHz (FW 310.70) | 42.40 fps |
|
|
|
| nVidia GeForce GTX 580 (FW 296.10) | 46.93 fps |
|
||
| nVidia GeForce GTX 660 Ti Boost Max 980 MHz (FW 310.70) | 45.86 fps |
|
||
| AMD Radeon HD 7950 (Catalyst 12.11B8) | 42.94 fps |
|
||
| nVidia GeForce GTX 570 (FW 296.10) | 41.85 fps |
|
||
| ASUS GeForce GTX 560 Ti 448 Cores DCU II (FW 296.10) | 39.90 fps |
|
|
|
| nVidia GeForce GTX 660 Boost Max 1'033 MHz (FW 310.70) | 38.62 fps |
|
|
|
| AMD Radeon HD 7870 (Catalyst 12.11B8) | 35.66 fps |
|
||
| AMD Radeon HD 6950 2GB (ASUS) (Catalyst 12.3) | 35.03 fps |
|
|
|
| nVidia GeForce GTX 560 Ti 1GB (FW 296.10) | 31.05 fps |
|
||
| AMD Radeon HD 6870 (Catalyst 12.3) | 28.75 fps |
|
||
| AMD Radeon HD 7850 (Catalyst 12.11B8) | 28.06 fps |
|
||
| nVidia GeForce GTX 650 Ti 1GB (FW 310.70) | 28.54 fps |
|
||
| AMD Radeon HD 6850 (Catalyst 12.3) | 22.33 fps |
|
||
| nVidia GeForce GTX 550 Ti (FW 296.10) | 18.50 fps |
|
||
| AMD Radeon HD 6770 (ASUS DCU Silent) (Catalyst 12.3) | 17.42 fps |
|
|
|
| AMD Radeon HD 7750 (Club3D Royal Queen) (Catalyst 12.4) | 13.88 fp |
|
|
|
| AMD Radeon HD 6670 1GB GDDR5 (Catalyst 12.3) | 10.98 fps |
|
||
| AMD Radeon HD 6570 GDDR5 (Catalyst 12.3) | 8.57 fps |
|
||
| More is better | ||||

Discuss this article in the forums [pagebreak]
S.T.A.L.K.E.R. Call of Pripyat

| S.T.A.L.K.E.R. Call of Pripyat Benchmark | Average | GPU-Z | Review | Gallery |
| AMD Radeon HD 6990 (Catalyst 12.3) | 70.13 fps |
|
|
|
| TGT GeForce GTX 680 BEAST LLS 1'241 (FW 310.70) | 68.28 fps |
|
|
|
| EVGA GeForce GTX 680 SC Signature2 (Turbo up to 1'201 MHz) (FW 310.70) | 66.09 fps |
|
|
|
| ASUS GeForce GTX 680 DCU II Top 1'201 MHz (FW 310.70) | 65.83 fps |
|
||
| EVGA GeForce GTX 680 SC (Turbo up to 1'215 MHz) (FW 310.70) | 65.60 fps |
|
|
|
| MSI GeForce GTX 680 TF OC (Turbo up to 1'163 MHz) (FW 310.70) | 64.00 fps |
|
|
|
| nVidia GeForce GTX 680 Boost Max 1'059 MHz (FW 310.70) | 62.70 fps |
|
|
|
| nVidia GeForce GTX 670 Boost Max 980 MHz (FW 310.70) | 56.37 fps |
|
|
|
| AMD Radeon HD 7970 (XFX Double Dissipation) (Catalyst 12.11B8) | 50.50 fps |
|
|
|
| nVidia GeForce GTX 660 Ti Boost Max 980 MHz (FW 310.70) | 44.18 fps |
|
||
| nVidia GeForce GTX 580 (FW 296.10) | 41.50 fps |
|
||
| nVidia GeForce GTX 660 Boost Max 1'033 MHz (FW 310.70) | 41.45 fps |
|
|
|
| AMD Radeon HD 7950 (Catalyst 12.11B8) | 40.57 fps |
|
||
| AMD Radeon HD 7870 (Catalyst 12.11B8) | 36.39 fps |
|
||
| nVidia GeForce GTX 570 (FW 296.10) | 35.63 fps |
|
||
| ASUS GeForce GTX 560 Ti 448 Cores DCU II (FW 296.10) | 33.68 fps |
|
|
|
| AMD Radeon HD 6950 2GB (ASUS) (Catalyst 12.3) | 30.74 fps |
|
|
|
| nVidia GeForce GTX 560 Ti 1GB (FW 296.10) | 30.00 fps |
|
||
| nVidia GeForce GTX 650 Ti 1GB (FW 310.70) | 27.72 fps |
|
||
| AMD Radeon HD 7850 (Catalyst 12.11B8) | 27.50 fps |
|
||
| AMD Radeon HD 6870 (Catalyst 12.3) | 24.43 fps |
|
||
| AMD Radeon HD 6850 (Catalyst 12.3) | 19.01 fps |
|
||
| nVidia GeForce GTX 550 Ti (FW 296.10) | 16.55 fps |
|
||
| AMD Radeon HD 6770 (ASUS DCU Silent) (Catalyst 12.3) | 15.60 fps |
|
|
|
| AMD Radeon HD 7750 (Club3D Royal Queen) (Catalyst 12.4) | 13.53 fps |
|
|
|
| AMD Radeon HD 6670 1GB GDDR5 (Catalyst 12.3) | 9.75 fps |
|
||
| AMD Radeon HD 6570 GDDR5 (Catalyst 12.3) | 7.58 fps |
|
||
| More is better | ||||

Discuss this article in the forums [pagebreak]
The Elder Scrolls V: Skyrim

| The Elder Scrolls V: Skyrim (5 Minutes GamePlay) | Average | GPU-Z | Review | Gallery |
| TGT GeForce GTX 680 BEAST LLS 1'241 (FW 310.70) | 90.78 fps |
|
|
|
| EVGA GeForce GTX 680 SC Signature2 (Turbo up to 1'201 MHz) (FW 310.70) | 90.69 fps |
|
|
|
| ASUS GeForce GTX 680 DCU II Top 1'201 MHz (FW 310.70) | 89.91 fps |
|
||
| MSI GeForce GTX 680 TF OC (Turbo up to 1'163 MHz) (FW 310.70) | 88.18 fps |
|
|
|
| nVidia GeForce GTX 680 Boost Max 1'059 MHz (FW 310.70) | 87.58 fps |
|
|
|
| AMD Radeon HD 7970 (XFX Double Dissipation) (Catalyst 12.11B8) | 82.73 fps |
|
|
|
| EVGA GeForce GTX 680 SC (Turbo up to 1'215 MHz) (FW 310.70) | 83.51 fps |
|
|
|
| AMD Radeon HD 7950 (Catalyst 12.11B8) | 80.31 fps |
|
||
| nVidia GeForce GTX 670 Boost Max 980 MHz (FW 310.70) | 80.05 fps |
|
|
|
| nVidia GeForce GTX 580 (FW 296.10) | 76.87 fps |
|
||
| AMD Radeon HD 6990 (Catalyst 12.3) | 69.64 fps |
|
|
|
| nVidia GeForce GTX 660 Ti Boost Max 980 MHz (FW 310.70) | 68.77 fps |
|
||
| nVidia GeForce GTX 660 Boost Max 1'033 MHz (FW 310.70) | 63.56 fps |
|
|
|
| nVidia GeForce GTX 570 (FW 296.10) | 60.22 fps |
|
||
| AMD Radeon HD 7850 (Catalyst 12.11B8) | 59.47 fps |
|
||
| ASUS GeForce GTX 560 Ti 448 Cores DCU II (FW 296.10) | 58.28 fps |
|
|
|
| AMD Radeon HD 7870 (Catalyst 12.11B8) | 71.30 fps |
|
||
| nVidia GeForce GTX 560 Ti 1GB (FW 296.10) | 51.10 fps |
|
||
| AMD Radeon HD 6950 2GB (ASUS) (Catalyst 12.3) | 50.28 fps |
|
|
|
| AMD Radeon HD 6870 (Catalyst 12.3) | 44.21 fps |
|
||
| nVidia GeForce GTX 650 Ti 1GB (FW 310.70) | 43.64 fps |
|
||
| AMD Radeon HD 6850 (Catalyst 12.3) | 37.58 fps |
|
||
| nVidia GeForce GTX 550 Ti (FW 296.10) | 32.19 fps |
|
||
| AMD Radeon HD 7750 (Club3D Royal Queen) (Catalyst 12.4) | 28.60 fps |
|
|
|
| AMD Radeon HD 6770 (ASUS DCU Silent) (Catalyst 12.3) | 25.92 fps |
|
|
|
| AMD Radeon HD 6670 1GB GDDR5 (Catalyst 12.3) | 18.04 fps |
|
||
| AMD Radeon HD 6570 GDDR5 (Catalyst 12.3) | 11.52 fps |
|
||
| More is better | ||||

Discuss this article in the forums [pagebreak]
StarCraft II

| StarCraft II (5 Minutes GamePlay) | Average | GPU-Z | Review | Gallery |
| AMD Radeon HD 7970 (XFX Double Dissipation) (Catalyst 12.11B8) | 85.94 fps |
|
|
|
| AMD Radeon HD 6990 (Catalyst 12.3) | 83.28 fps |
|
|
|
| AMD Radeon HD 7950 (Catalyst 12.11B8) | 83.95 fps |
|
||
| AMD Radeon HD 7850 (Catalyst 12.11B8) | 82.69 fps |
|
||
| AMD Radeon HD 7870 (Catalyst 12.11B8) | 81.96 fps |
|
||
| AMD Radeon HD 6950 2GB (ASUS) (Catalyst 12.3) | 80.96 fps |
|
|
|
| TGT GeForce GTX 680 BEAST LLS 1'241 (FW 310.70) | 80.89 fps |
|
|
|
| AMD Radeon HD 6870 (Catalyst 12.3) | 80.33 fps |
|
||
| nVidia GeForce GTX 680 Boost Max 1'059 MHz (FW 310.70) | 77.94 fps |
|
|
|
| ASUS GeForce GTX 680 DCU II Top 1'201 MHz (FW 310.70) | 77.51 fps |
|
||
| MSI GeForce GTX 680 TF OC (Turbo up to 1'163 MHz) (FW 310.70) | 77.06 fps |
|
|
|
| EVGA GeForce GTX 680 SC Signature2 (Turbo up to 1'201 MHz) (FW 310.70) | 77.01 fps |
|
|
|
| EVGA GeForce GTX 680 SC (Turbo up to 1'215 MHz) (FW 310.70) | 76.93 fps |
|
|
|
| nVidia GeForce GTX 580 (FW 296.10) | 76.92 fps |
|
||
| nVidia GeForce GTX 660 Ti Boost Max 980 MHz (FW 310.70) | 76.02 fps |
|
||
| nVidia GeForce GTX 660 Boost Max 1'033 MHz (FW 310.70) | 75.70 fps |
|
|
|
| ASUS GeForce GTX 560 Ti 448 Cores DCU II (FW 296.10) | 75.52 fps |
|
|
|
| nVidia GeForce GTX 670 Boost Max 980 MHz (FW 310.70) | 75.23 fps |
|
|
|
| nVidia GeForce GTX 570 (FW 296.10) | 74.84 fps |
|
||
| nVidia GeForce GTX 560 Ti 1GB (FW 296.10) | 74.16 fps |
|
||
| nVidia GeForce GTX 650 Ti 1GB (FW 310.70) | 70.58 fps |
|
||
| AMD Radeon HD 6850 (Catalyst 12.3) | 69.08 fps |
|
||
| nVidia GeForce GTX 550 Ti (FW 296.10) | 57.44 fps |
|
||
| AMD Radeon HD 7750 (Club3D Royal Queen) (Catalyst 12.4) | 47.66 fps |
|
|
|
| AMD Radeon HD 6770 (ASUS DCU Silent) (Catalyst 12.3) | 44.98 fps |
|
|
|
| AMD Radeon HD 6670 1GB GDDR5 (Catalyst 12.3) | 31.06 fps |
|
||
| AMD Radeon HD 6570 GDDR5 (Catalyst 12.3) | 26.89 fps |
|
||
| More is better | ||||

Discuss this article in the forums [pagebreak]
Power Consumption

| Power Consumption Idle | Power Consumption | GPU-Z | Review | Gallery |
| AMD Radeon HD 6990 (Catalyst 12.3) | 97.0 Watts |
|
|
|
| nVidia GeForce GTX 580 (FW 296.10) | 91.5 Watts |
|
||
| ASUS GeForce GTX 560 Ti 448 Cores DCU II (FW 296.10) | 81.0 Watts |
|
|
|
| ASUS GeForce GTX 680 DCU II Top 1'201 MHz (FW 310.70) | 74.0 Watts |
|
||
| AMD Radeon HD 6950 2GB (ASUS) (Catalyst 12.3) | 73.0 Watts |
|
|
|
| AMD Radeon HD 6870 (Catalyst 12.3) | 70.5 Watts |
|
||
| EVGA GeForce GTX 680 SC (Turbo up to 1'215 MHz) (FW 310.70) | 70.0 Watts |
|
|
|
| EVGA GeForce GTX 680 SC Signature2 (Turbo up to 1'201 MHz) (FW 310.70) | 68.0 Watts |
|
|
|
| MSI GeForce GTX 680 TF OC (Turbo up to 1'163 MHz) (FW 310.70) | 67.0 Watts |
|
|
|
| TGT GeForce GTX 680 BEAST LLS 1'241 (FW 310.70) | 65.0 Watts |
|
|
|
| AMD Radeon HD 7970 (XFX Double Dissipation) (Catalyst 12.11B8) | 65.0 Watts |
|
|
|
| AMD Radeon HD 6770 (ASUS DCU Silent) (Catalyst 12.3) | 65.0 Watts |
|
|
|
| AMD Radeon HD 6570 GDDR5 (Catalyst 12.3) | 64.0 Watts |
|
||
| AMD Radeon HD 7750 (Club3D Royal Queen) (Catalyst 12.4) | 60.0 Watts |
|
|
|
| Less is better | ||||
| Power Consumption Load (FurMark) | Power Consumption | GPU-Z | Review | Gallery |
| AMD Radeon HD 6990 (Catalyst 12.3) | 410.0 Watts |
|
|
|
| nVidia GeForce GTX 580 (FW 296.10) (No Throttling) | 330.0 Watts |
|
||
| ASUS GeForce GTX 560 Ti 448 Cores DCU II (FW 296.10) | 270.0 Watts |
|
|
|
| AMD Radeon HD 7970 (XFX Double Dissipation) (Catalyst 12.11B8) | 250.0 Watts |
|
|
|
| EVGA GeForce GTX 680 SC (Turbo up to 1'215 MHz) (FW 310.70) | 240.0 Watts |
|
|
|
| TGT GeForce GTX 680 BEAST LLS 1'241 (FW 310.70) | 235.0 Watts |
|
|
|
| ASUS GeForce GTX 680 DCU II Top 1'201 MHz (FW 310.70) | 233.0 Watts |
|
||
| EVGA GeForce GTX 680 SC Signature2 (Turbo up to 1'201 MHz) (FW 310.70) | 233.0 Watts |
|
|
|
| MSI GeForce GTX 680 TF OC (Turbo up to 1'163 MHz) (FW 310.70) | 230.0 Watts |
|
|
|
| AMD Radeon HD 6950 2GB (ASUS) (Catalyst 12.3) | 212.0 Watts |
|
|
|
| AMD Radeon HD 6870 (Catalyst 12.3) | 195.0 Watts |
|
||
| AMD Radeon HD 6770 (ASUS DCU Silent) (Catalyst 12.3) | 142.5 Watts |
|
|
|
| AMD Radeon HD 6570 GDDR5 (Catalyst 12.3) | 127.0 Watts |
|
||
| AMD Radeon HD 7750 (Club3D Royal Queen) (Catalyst 12.4) | 119.0 Watts |
|
|
|
| Less is better | ||||
| Difference Idle/Load | Power Consumption | GPU-Z | Review | Gallery |
| AMD Radeon HD 6990 (Catalyst 12.3) | 313.0 Watts |
|
|
|
| nVidia GeForce GTX 580 (FW 296.10) (No Throttling) | 239.5 Watts |
|
||
| ASUS GeForce GTX 560 Ti 448 Cores DCU II (FW 296.10) | 189.0 Watts |
|
|
|
| AMD Radeon HD 7970 (XFX Double Dissipation) (Catalyst 12.11B8) | 185.0 Watts |
|
|
|
| TGT GeForce GTX 680 BEAST LLS 1'241 (FW 310.70) | 170.0 Watts |
|
|
|
| EVGA GeForce GTX 680 SC (Turbo up to 1'215 MHz) (FW 310.70) | 170.0 Watts |
|
|
|
| EVGA GeForce GTX 680 SC Signature2 (Turbo up to 1'201 MHz) (FW 310.70) | 165.0 Watts |
|
|
|
| MSI GeForce GTX 680 TF OC (Turbo up to 1'163 MHz) (FW 310.70) | 163.0 Watts |
|
|
|
| ASUS GeForce GTX 680 DCU II Top 1'201 MHz (FW 310.70) | 159.0 Watts |
|
||
| AMD Radeon HD 6950 2GB (ASUS) (Catalyst 12.3) | 139.0 Watts |
|
|
|
| AMD Radeon HD 6870 (Catalyst 12.3) | 124.5 Watts |
|
||
| AMD Radeon HD 6770 (ASUS DCU Silent) (Catalyst 12.3) | 77.5 Watts |
|
|
|
| AMD Radeon HD 6570 GDDR5 (Catalyst 12.3) | 63.0 Watts |
|
||
| AMD Radeon HD 7750 (Club3D Royal Queen) (Catalyst 12.4) | 59.0 Watts |
|
|
|
| More is better | ||||

Discuss this article in the forums [pagebreak]
Fan Speed / Noise Level
Fan Speed

Noise Level

For the noise level results, we measured the noise level using a decibel meter (Voltcraft SL-200) located at 1 meter away from the graphics card.
Discuss this article in the forums [pagebreak]
Idle / FurMark
Idle Temperature

Idle, temperature is taken after 15 minutes @ 30 %, 50 % and 100 % fan speed.
Room Temperature: 25°C
Temperature under Furmark

For FurMark, temperature is taken after 15 minutes of GPU Burn test @ 30 %, 50 % and 100 % fan speed.
We stopped the test when the GPU temperature hit 90°C.
Room Temperature: 25°C
Discuss this article in the forums [pagebreak]
BattleField 3

Highest temperature reached under BattleField 3 @ 30 %, 50 % and 100 % fan speed after 1 hour gameplay.
We stopped the test when the GPU temperature hit 90°C.
Discuss this article in the forums [pagebreak]
BenchMarks and Games Settings
Futuremark
- 3DMark 11 (1.0.3)
- GPU Test - Performance Preset
- 3DMark Vantage (1.1.0)
- GPU Test - Performance Preset
Unigine Heaven DX11 Benchmark
| Version | 3.0 |
| API | DirectX 11 |
| Tessellation | Extreme |
| Shaders | High |
| Anisotropy | 16x |
| Stereo 3D | Disabled |
| Anti-aliasing | 8x |
| Full Screen | Yes |
| Resolution | 1920 x 1080 |
Geeks3D TessMark
| Version | 0.3.0 |
| Map Set | Set 4 (2048 x 2048) |
| Tesselation | Insane (x64) |
| Full Screen | Yes |
| Resolution | 1920 x 1080 |
| Anti-aliasing | 8x |
| Tessellation | High |
| Duration | 60000 (ms) |
Geeks3D FurMark (Burn-in test)
| Version | 1.10.0 |
| Full Screen | Yes |
| Resolution | 1920 x 1080 |
| Anti-aliasing | 8x MSAA |
Alien vs Predator DX11 Benchmark
| Version | 1.0.0.0 |
| Texture Quality | Very High |
| Shadow Quality | High |
| Hardware Tesselation | Yes |
| Advance Shadow Sampling | Yes |
| Full Srceen Anti-Aliasing Samples | 4x |
| Anisotropic Filtering | 16x |
| SSAO | On |
| Screen Resolution | 1920 x 1080 |
Batman: Arkham City Integrated Benchmark
| Version | 1.0.0.0 |
| FullScreen | Yes |
| Resolution | 1920 x 1080 |
| V Sync | No |
| Anti-Aliasing | 8x MSAA |
| Stereoscopic 3D Status | No |
| DirectX 11 Features | MVSS And HBAO |
| DirectX 11 Tesselation | High |
| Detail Level | Extreme |
| Dynamic Shadow | Yes |
| Motion Blur | Yes |
| Distortion | Yes |
| Lens Flares | Yes |
| Light Shafts | Yes |
| Reflections | Yes |
| Ambient Occlusion | Yes |
| Hardware Accelerated PhysX | Off |
Call Of Duty Modern Warfare 3 (5 Minutes GamePlay)
| Version | ??? |
| Resolution | 1920 x 1080 |
| FullScreen | On |
| Vertical Sync | Off |
| Field of view | 70 |
| Motion Blur Amount | Max |
| Graphics Quality | Ultra |
BattleField 3 (5 Minutes GamePlay)
| Version | 1.0.0.0 |
| Resolution | 1920 x 1080 |
| Aspect Ratio | Wide 16:9 |
| Anti-Aliasing | 4x |
| Screen Refresh Rate | 60 Hz |
| Sync Every Frame | No |
| Shadows | Yes |
| Specular Map | Yes |
| Depth Of Field | Yes |
| Screen Space Ambient Occlusion | High Quality |
| Soften Smoke Edges | Yes |
| Bullet Impacts | Yes |
| Image Quality | Ultra |
Crysis 2 DX11 + HiRes Texture Pack Benchmark
| Version | 1.9.0.0 |
| Quality | Ultra |
| Resolution | 1920 x 1080 |
| Anti-Aliasing | 4x |
| Map | Central Park/Adrenaline |
| Runs | 1 |
| API | DirectX 11 |
| Edge AA | Edge AA |
| Hi-Res Textures | On |
DIRT 2 Integrated Benchmark
| Version | 1.1.0.0 |
| Resolution | 1920 x 1080 |
| Refresh Rate | 60 |
| MultiSampling | 8x MSAA |
| VSync | Off |
| Aspect Ration | 16:9 |
| Details | Ultra Preset |
Dragon Age II (5 Minutes GamePlay)
| Version | 1.04 |
| Resolution | 1920 x 1080 |
| Full Screen Mode | Yes |
| Renderer | DirectX 11 |
| Vertical Sync | no |
| Graphics Detail | Very High |
| Anti-Aliasing | 8x |
| Anisotropic Filtering | 16x |
| Screen Space Ambient Occlusion | Yes |
| Diffusion Depth of Field | Yes |
| High Quality Blur | Yes |
StarCraft II (5 Minutes GamePlay)
| Version | 1.2.1.1631 |
| Display Mode | FullScreen |
| Refresh Rate | Default |
| Resolution | 1920 x 180 |
| Vertical Sync | No |
| Texture Quality | Ultra |
| Graphics Quality | Ultra |
The Elder Scrolls V: Skyrim (5 Minutes GamePlay)
| Version | 1.7.7.0.6 |
| Resolution | 1920 x 1080 |
| Aspect Ratio | Wide 16:9 |
| Anti-Aliasing | 8x |
| Anisotropic-Filtering | 16x |
| Details | Ultra |
| Vertical Sync | Disabled |
S.T.A.L.K.E.R. Call of Pripyat Benchmark
| Version | 1.5.8.1 |
| Preset | Ultra |
| Renderer | Enhan. full dyn. lighting (DX11) |
| Video Mode | 1920 x 1080 |
| MSAA | 4x |
| MSAA for A-tested objects | DX10.0 Style [Standard] |
| SSAO Mode | HDAO |
| SSAO Quality | High |
| Use DX10.1 | No |
| Enable Tesselation | Yes |
| Contact Hardening Shadows | Yes |
Discuss this article in the forums [pagebreak]
Conclusion
| General | + | - | |
This DirectCU II Top from ASUS has definitely been able to convince us. Thanks
to the factory overclocking the card is eight percent faster than the reference
clocked ones. |
- Silent under load
- Factory Overclocking - Design - Custom PCB |
- Audible in idle - No factory overclock on the memory | |
| Performance | + | - | |
Thanks to the factory overclocking the
DirectCU II is eight percent faster than the reference clocked GTX 680.
Although there is a massive overlocking regarding the GPU it's not able
to outperform the EVGA card we tested. The reason for that lies within
the memory, since EVGA overclocks it and ASUS doesn't. Still the factory
overclocking on the GPU is everything but shy. Another interesting fact
is that our sample was working at 1'202 MHz all the time under load. It
appeared to not make use of the boost feature. 1'202 MHz means that there is a factory
overclocking of 144 MHz over the boost clock of reference cards. |
- Performance - 8 % faster than the reference GTX 680 - Power Consumption under load - Cooler |
- Triple slot cooler - Power Consumption in idle | |
| Recommendation | + | - | |
| We recommend this graphics card to people who are looking for a factory overclocked GTX 680 which features a very good and silent cooler. This card is about 80 € more expensive than the cheapest reference GTX 680, therefore you should be really sure that this is the exact card you want. |
- Gaming - Overclocking |
||
| We gave the GTX680-DC2T-2GD5 the almost perfect award of 4 out of 5 stars. | |||

Discuss this article in the forums
Author: Christian Ney c.ney@ocaholic.ch