 With the Z77X-UD5H-WB WiFi, Gigabyte has a very well equipped motherboard in its portfolio. This allrounder board offers many features like for example WiFi support, a powerful power design and there is even a complete set of overclocking features. This board really brings everything that is needed to become a convincing product.
On the following pages we're going to show you if Gigabyte succeeding in convincing us with their brand new Z77X-UD5H-WB Wifi regarding layout and design.
Discuss this article in the forums
[pagebreak]
Specifications / Delivery
| CPU | Intel Socket 1155 |
| Chipset | Intel Z77 |
| Memory | 4 x DIMM max 32 GB, DDR3 2400 (OC) / 1600 / 1333 /
1066 MHz Dual Channel |
| Multi-GPU | NVIDIA 2-Way (16x, 8x) SLI AMD 2-Way (16x, 8x) CorssFireX |
| Slots | 1 x PCI-Express 3.0/2.0 x16 @ x16 1 x PCI-Express 3.0/2.0 x16 @ x8 1 x PCI-Express 3.0/2.0 x16 @ x4 3 x PCI-Express 2.0 x1 1 x PCI |
| Audio | Realtek ALC 898 8-Channel |
| Storage | 2 x SATA3 6.0 Gb/s (Intel Chipset, RAID 0, 1, 5, 0+1) 4 x SATA2 3.0 Gb/s 1 x mSATA2 3.0 Gb/s (The fifth SATA2 connector will become unavailable when a mSATA device is installed) 3 x SATA 6.0 Gb/s (2x Marvell 88SE9172, RAID 0, 1) 1 x eSATA 6Gb/s |
| LAN | 1 x Qualcomm Atheros LAN chip (10/100/1000 Mbit) (LAN1) 1 x Intel GbE LAN (10/100/1000 Mbit) (LAN2) |
| I/O internal | |
| I/O Back Panel | |
| Bundle | |
| Formfactor | ATX (30.5cm x 24.4 cm) |
| Warranty | 5 years |
| On Manufacturer's Website | Gigabyte Z77X-UD5H-WB WiFi |
| BIOS | 2 x Bios (64 Mbit flash ROM, EFI AMI BIOS) |


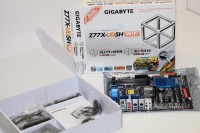


Uboxing the Z77X-UD5H-WB WiFi shows a lot of accessories. Next to a set of SATA cables one will find an SLI bridge as well as a 3.5 inch front mount panel with two USB 3.0 ports. Furhtermore there are the different manuals, the wireless LAN and bluetooth expansion card as well as software and drivers on DVD.
Features
| 3D Power | Meanwhile Gigabyte also makes use of digital power designs on their motherboards. What it does is that it controls the flow of power to both CPU and memory. Gigabyte in this case promises maximum stability. |
| 3D BIOS | With their X79 motherboards Gigabyte introduced their interpretation of a UEFI-BIOS. With the Z77 boards you get the same 3D BIOS. Using a new Gigabyte board you can choose from a 3D Mode or the Advanced Mode. In 3D Mode one can see a picture of the board in BIOS. If you hover over the different areas you can select them and afterwards change the related settings. On the other hand there is the more standard advanced mode which come with a well-known tab based user interface. |
| PCI Epxress 3.0 | The Z77X-UD5H already has PCI-Express 3.0 Support onboard. Therefore this board is ready for upcoming GPU generations that need even more bandwidth. |
| Bluetooth 4.0 and WiFi | The motherboard also includes an exclusive PCIe expansion card that offers support for the latest Bluetooth 4.0 and IEEE 802.11 a/b/g/n Wi-Fi connectivity. The Bluetooth 4.0 standard includes Smart Ready technology that is debuting on mobile devices including the Apple iPhone 4s. This means that transferring important content from your smart phone or tablet is easier and faster than ever. |
Discuss this article in the forums
[pagebreak]
Layout
The Gigabyte Z77X-UD5H-WB comes on a black PCB with the blue coolers and black expansion slots. The layout itself has been well thought and there is for example plenty of space around the CPU socket to install even todays largest CPU coolers. There also are angled SATA connectors which let you install oversized graphics cards easily.

Gigabyte equipped the Gigabyte Z77X-UD5H-WB WiFi with a 15 (6x2 + 2 + 1) phase power design for the processor. In fact there are six times two phases for vcore, two phases for IGP (Integrated Graphic Processor) and finally one phase for IMC (Integrated Memory Controller)/VTT. As for the other components, the memory benefits power from two phases, the PCH - also known as southbridge - is powered by one single phase.

Totally you'll find four DIMM-slots on the Gigabyte Z77X-UD5H-WB WiFi. Officially supported are the following clock speeds: 2400 / 1600 / 1333 / 1066 MHz. There is also enough space between the DIMM-slots and the CPU socket which means that you won't encounter compatibility issues with tower coolers even when you choose to install RAM with big heatspreaders. Meanwhile with a double tower cooler you may find some incompatibility issues with high end memory that ships with huge heatspreaders.

On the Gigabyte Z77X-UD5H-WB WiFi southbridge as well as VRM are being cooled via passive cooling blocks that are connected to eachother via heatpipes. The coolers for the VRM are well positioned and also around the DIMM slots there is plenty of space. Therefore no cooler will collide with one of the onboard components.


Discuss this article in the forums
[pagebreak]
Connectors and I/O
Totally Gigabyte equipped the Z77X with eight
angled SATA ports on one straight port, located at the bottom edge of the board.
This is enough for every office PC, gaming rig or overclocking setup.
At the top right corner of the motherboard we were happy to find a useful clear
CMOS button as well as a reset and power button. Also located in the same area
you will find the LED debug display that is very practical if you experience any
hardware issues. There are even voltage reading points in this area, which are
useful for us extreme overclockers. As for the bottom part of the motherboard
you will be able to find additional connectors and a bios switch as
well.


Totally you'll find five fan headers on the Gigabyte Z77X-UD5H-WB WiFi which is more than enough to provide an overclocking rig or even a high-end gaming machine with plenty of fresh air. The fan headers are located around the CPU and their also spread over the entire board which makes it easy to access from any position in an enclosure.


Looking at the external connectors directly at the back-panel Gigabyte equipped the Z77X-UD5H with four USB 3.0 ports, two USB 2.0 ports, two RJ45 connectors, an optical out as well as an analogue audio panel. Furhtermore you'll also find video connectors like VGA, DVI, HDMI and DisplayPort connectors.

Discuss this article in the forums
[pagebreak]
BIOS
Also for their Z77 motherboards Gigabyte is using a graphical UEFI BIOS that can be controled via mouse and keyboard. An interesting and for unexperienced useres practical approach is the picture one can see when the BIOS is accessed. In fact it is an interactive graphic which lets you click on certain areas of the board to select them.


Discuss this article in the forums [pagebreak]
Test setup
Hardware |
|
| Motherboard |
|
| Processor | Intel Core i7-3770K, 3.5 GHz |
| Memory | 4 Gigabyte Kingston H2O KHX2133 @ 1600 MHz CL8-8-8-24 |
| Graphic card | ASUS ENGTX 580 |
| Driver | Version 275.33 |
| Hard disk | Samsung Spinpoint F1 320 GByte |
| Power supply | bequiet! Dark Power Pro 1000Watt |
Discuss this article in the forums
[pagebreak]
3D Mark
3D Mark11
3DMark 11 is Futuremarks latest benchmark for the entire graphical subsystem. The benchmark uses DirectX 11 and it supports all recent features which can possibly generate high load on a GPU. Therefore you find tessellation, compute shader calculations, divers lighting effects and different depth of filed animations. Following we publish values regarding the performance preset of 3DMark 11.
Total
| 3D Mark 11 Total |
Review Rating |
Percent | |
| ASUS Sabertooth Z77 |
No Review |
6'666 | 100.03 % |
| ASUS P8Z77-V |
No Review |
6'664 | 100.00 % |
| Intel DZ77GA-70K |
No Review |
6'664 | 100.00 % |
| ASUS P8Z77-I Deluxe |
No Review |
6'663 | 99.98 % |
| Gigabyte Z77MX-D3H |
No Review |
6'663 | 99.98 % |
| ASUS Maximus V Gene |
No Review |
6'662 | 99.97 % |
| ASUS P8Z77-V Deluxe |
No Review |
6'660 | 99.94 % |
| ASUS P8H77-M LE/SI |
No Review |
6'656 | 99.88 % |
| Gigabyte Z77X-UD5H |
No Review |
6'655 | 99.86 % |
| ASUS P8Z77 WS |
No Review |
6'650 | 99.79 % |
| ASRock Z77 Extreme6 |
No Review |
6'649 | 99.77 % |
| ASUS P8H77-I |
No Review |
6'639 | 99.62 % |
| Gigabyte Z77 G1.Sniper 3 |
No Review |
6'587 | 98.84 % |
| Biostar TZ77XE4 TOverclocker |
No Review |
6'568 | 98.56 % |
| more is better | |||
Physic
| 3D Mark 11 CPU Score |
Review Rating |
Percent | |
| ASUS P8Z77-V Deluxe |
No Review |
9'446 | 101.22 % |
| ASUS P8Z77-V |
No Review |
9'446 | 101.22 % |
| ASUS Maximus V Gene |
No Review |
9'426 | 101.01 % |
| ASUS P8Z77 WS |
No Review |
9'424 | 100.99 % |
| ASUS P8Z77-I Deluxe |
No Review |
9'414 | 100.88 % |
| ASUS Sabertooth Z77 |
No Review |
9'412 | 100.86 % |
| Biostar TZ77XE4 TOverclocker |
No Review |
9'396 | 100.68 % |
| Gigabyte Z77MX-D3H |
No Review |
9'376 | 100.47 % |
| Gigabyte Z77 G1.Sniper 3 |
No Review |
9'354 | 100.24 % |
| ASUS P8H77-M LE/SI |
No Review |
9'347 | 100.16 % |
| Intel DZ77GA-70K |
No Review |
9'332 | 100.00 % |
| Gigabyte Z77X-UD5H |
No Review |
9'324 | 99.91 % |
| ASRock Z77 Extreme6 |
No Review |
9'246 | 99.08 % |
| ASUS P8H77-I |
No Review |
9'081 | 97.31 % |
| more is better | |||
Discuss this article in the forums [pagebreak]
3D Mark Vantage
3DMark Vantage is able to squeeze a lot out of a recent system. Therefore the feature liste is also pretty long: DirectX10, FP16-HDR, motion blur, parallax occlusion mapping, GPU-physics simulation and different shader effects are being used to even make recent high-end systems struggle.
Total
| 3D Mark Vantage Total |
Review Rating |
Percent | |
| ASUS Maximus V Gene |
No Review |
26'270 | 100.81 % |
| Gigabyte Z77X-UD5H |
No Review |
26'255 | 100.76 % |
| Gigabyte Z77MX-D3H |
No Review |
26'254 | 100.75 % |
| ASUS P8Z77-I Deluxe |
No Review |
26'229 | 100.66 % |
| ASRock Z77 Extreme6 |
No Review |
26'136 | 100.30 % |
| ASUS Sabertooth Z77 |
No Review |
26'123 | 100.25 % |
| ASUS P8Z77-V |
No Review |
26'088 | 100.12 % |
| ASUS P8Z77-V Deluxe |
No Review |
26'084 | 100.10 % |
| ASUS P8Z77 WS |
No Review |
26'062 | 100.01 % |
| ASUS P8H77-M LE/SI |
No Review |
26'059 | 100.00 % |
| Intel DZ77GA-70K |
No Review |
26'058 | 100.00 % |
| ASUS P8H77-I |
No Review |
25'994 | 99.75 % |
| Gigabyte Z77 G1.Sniper 3 |
No Review |
25'929 | 99.50 % |
| Biostar TZ77XE4 TOverclocker |
No Review |
25'633 | 98.37 % |
| more is better | |||
CPU
| 3D Mark Vantage CPU |
Review Rating |
Percent | |
| ASUS P8Z77 WS |
No Review |
25'421 | 101.25 % |
| Gigabyte Z77MX-D3H |
No Review |
25'383 | 101.10 % |
| Gigabyte Z77X-UD5H |
No Review |
25'378 | 101.08 % |
| ASUS Sabertooth Z77 |
No Review |
25'354 | 100.98 % |
| ASUS P8Z77-I Deluxe |
No Review |
25'327 | 100.87 % |
| ASUS Maximus V Gene |
No Review |
25'300 | 100.76 % |
| ASUS P8Z77-V Deluxe |
No Review |
25'290 | 100.72 % |
| ASUS P8Z77-V |
No Review |
25'255 | 100.59 % |
| Biostar TZ77XE4 TOverclocker |
No Review |
25'168 | 100.24 % |
| Intel DZ77GA-70K |
No Review |
25'108 | 100.00 % |
| ASUS P8H77-I |
No Review |
25'100 | 99.97 % |
| ASRock Z77 Extreme6 |
No Review |
25'067 | 99.84 % |
| ASUS P8H77-M LE/SI |
No Review |
25'054 | 99.78 % |
| Gigabyte Z77 G1.Sniper 3 |
No Review |
25'034 | 99.71 % |
| more is better | |||
Discuss this article in the forums
[pagebreak]
3D Mark 2001
| 3D Mark 2001 |
Review Rating |
Percent | |
| ASUS Maximus V Gene |
No Review |
61'335 | 101.86 % |
| ASRock Z77 Extreme6 |
No Review |
60'998 | 101.30 % |
| ASUS Sabertooth Z77 |
No Review |
60'947 | 101.21 % |
| ASUS P8Z77 WS |
No Review |
60'808 | 100.98 % |
| ASUS P8Z77-I Deluxe |
No Review |
60'607 | 100.65 % |
| Biostar TZ77XE4 TOverclocker |
No Review |
60'360 | 100.24 % |
| ASUS P8Z77-V |
No Review |
60'359 | 100.24 % |
| Intel DZ77GA-70K |
No Review |
60'216 | 100.00 % |
| Gigabyte Z77MX-D3H |
No Review |
60'026 | 99.68 % |
| ASUS P8H77-I |
No Review |
59'875 | 99.43 % |
| ASUS P8H77-M LE/SI |
No Review |
59'762 | 99.25 % |
| ASUS P8Z77-V Deluxe |
No Review |
59'743 | 99.21 % |
| Gigabyte Z77 G1.Sniper 3 |
No Review |
59'623 | 99.02 % |
| Gigabyte Z77X-UD5H |
No Review |
59'255 | 98.40 % |
| more is better | |||
Discuss this article in the forums [pagebreak]
PC Mark 07
3DMark 11 is Futuremarks latest benchmark for the entire graphical subsystem. The benchmark uses DirectX 11 and it supports all recent features which can possibly generate high load on a GPU. Therefore you find tessellation, compute shader calculations, divers lighting effects and different depth of filed animations. Following we publish values regarding the performance preset of 3DMark 11.
Total
| PC Mark 07 Total |
Review Rating |
Percent | |
| Intel DZ77GA-70K |
No Review |
5'336 | 100.00 % |
| Gigabyte Z77 G1.Sniper 3 |
No Review |
5'328 | 99.85 % |
| ASUS Maximus V Gene |
No Review |
5'322 | 99.74 % |
| ASUS P8Z77-I Deluxe |
No Review |
5'318 | 99.66 % |
| Gigabyte Z77MX-D3H |
No Review |
5'318 | 99.66 % |
| ASUS P8Z77 WS |
No Review |
5'257 | 98.52 % |
| Gigabyte Z77X-UD5H |
No Review |
5'251 | 98.41 % |
| ASUS P8Z77-V Deluxe |
No Review |
5'241 | 98.21 % |
| ASRock Z77 Extreme6 |
No Review |
5'240 | 98.20 % |
| ASUS P8Z77-V |
No Review |
5'235 | 98.11 % |
| Biostar TZ77XE4 TOverclocker |
No Review |
5'223 | 97.88 % |
| ASUS P8H77-M LE/SI |
No Review |
5'209 | 97.62 % |
| ASUS Sabertooth Z77 |
No Review |
5'208 | 97.60 % |
| ASUS P8H77-I |
No Review |
5'201 | 97.47 % |
| more is better | |||
| Video playback and transcoding / Video playback |
Review Rating |
fps | Percent |
| ASUS P8Z77 WS |
No Review |
23.13 | 100.00 % |
| Intel DZ77GA-70K |
No Review |
23.13 | 100.00 % |
| ASRock Z77 Extreme6 |
No Review |
23.12 | 99.57 % |
| ASUS P8Z77-V |
No Review |
23.12 | 99.57 % |
| ASUS Maximus V Gene |
No Review |
23.11 | 99.91 % |
| Biostar TZ77XE4 TOverclocker |
No Review |
23.11 | 99.91 % |
| Gigabyte Z77X-UD5H |
No Review |
23.11 | 99.91 % |
| Gigabyte Z77MX-D3H |
No Review |
23.11 | 99.91 % |
| Gigabyte Z77 G1.Sniper 3 |
No Review |
23.10 | 99.87 % |
| ASUS Sabertooth Z77 |
No Review |
23.10 | 99.87 % |
| ASUS P8Z77-V Deluxe |
No Review |
23.10 | 99.87 % |
| ASUS P8Z77-I Deluxe |
No Review |
23.10 | 99.87 % |
| ASUS P8H77-M LE/SI |
No Review |
23.10 | 99.87 % |
| ASUS P8H77-I |
No Review |
23.10 | 99.87 % |
| more is better | |||
| Graphics - DirectX 9 / Graphics - DirectX 9 |
Review Rating |
fps | Percent |
| ASRock Z77 Extreme6 |
No Review |
90.71 | 101.45 % |
| ASUS P8Z77-I Deluxe |
No Review |
90.50 | 101.22 % |
| Gigabyte Z77MX-D3H |
No Review |
90.39 | 101.10 % |
| Gigabyte Z77 G1.Sniper 3 |
No Review |
90.32 | 101.02 % |
| ASUS P8Z77 WS |
No Review |
90.15 | 100.83 % |
| ASUS Sabertooth Z77 |
No Review |
90.11 | 100.78 % |
| ASUS Maximus V Gene |
No Review |
90.09 | 100.76 % |
| Gigabyte Z77X-UD5H |
No Review |
89.93 | 100.58 % |
| Biostar TZ77XE4 TOverclocker |
No Review |
89.59 | 100.20 % |
| Intel DZ77GA-70K |
No Review |
89.41 | 100.00 % |
| ASUS P8Z77-V |
No Review |
89.30 | 99.88 % |
| ASUS P8Z77-V Deluxe |
No Review |
88.77 | 99.28 % |
| ASUS P8H77-M LE/SI |
No Review |
88.43 | 98.90 % |
| ASUS P8H77-I |
No Review |
88.29 | 98.75 % |
| more is better | |||
| Image manipulation / Image manipulation |
Review Rating |
Mpx/s | Percent |
| ASUS P8Z77 WS |
No Review |
11.88 | 100.93 % |
| ASUS P8Z77-V |
No Review |
11.83 | 100.51 % |
| ASUS Sabertooth Z77 |
No Review |
11.83 | 100.51 % |
| ASUS P8Z77-V Deluxe |
No Review |
11.83 | 100.51 % |
| ASUS Maximus V Gene |
No Review |
11.81 | 100.34 % |
| Gigabyte Z77 G1.Sniper 3 |
No Review |
11.79 | 100.17 % |
| ASRock Z77 Extreme6 |
No Review |
11.78 | 100.08 % |
| Gigabyte Z77X-UD5H |
No Review |
11.78 | 100.08 % |
| Intel DZ77GA-70K |
No Review |
11.77 | 100.00 % |
| Biostar TZ77XE4 TOverclocker |
No Review |
11.77 | 100.00 % |
| ASUS P8Z77-I Deluxe |
No Review |
11.76 | 99.92 % |
| Gigabyte Z77MX-D3H |
No Review |
11.76 | 99.92 % |
| ASUS P8H77-M LE/SI |
No Review |
11.74 | 99.75 % |
| ASUS P8H77-I |
No Review |
11.72 | 99.58 % |
| more is better | |||
| Web browsing and decrypting / Web browsing |
Review Rating |
Pages/s | Percent |
| Biostar TZ77XE4 TOverclocker |
No Review |
18.19 | 100.94 % |
| ASUS P8Z77-V Deluxe |
No Review |
18.13 | 100.61 % |
| Gigabyte Z77 G1.Sniper 3 |
No Review |
18.07 | 100.28 % |
| ASUS P8Z77-I Deluxe |
No Review |
18.04 | 100.11 % |
| Gigabyte Z77X-UD5H |
No Review |
18.03 | 100.06 % |
| Intel DZ77GA-70K |
No Review |
18.02 | 100.00 % |
| Gigabyte Z77MX-D3H |
No Review |
17.99 | 99.83 % |
| ASRock Z77 Extreme6 |
No Review |
17.95 | 99.61 % |
| ASUS P8H77-M LE/SI |
No Review |
17.93 | 99.50 % |
| ASUS P8Z77-V |
No Review |
17.92 | 99.45 % |
| ASUS Sabertooth Z77 |
No Review |
17.91 | 99.39 % |
| ASUS P8H77-I |
No Review |
17.83 | 98.95 % |
| ASUS Maximus V Gene |
No Review |
17.74 | 98.45 % |
| ASUS P8Z77 WS |
No Review |
17.60 | 97.67 % |
| more is better | |||
Discuss this article in the forums
[pagebreak]
SiSoft Sandra 1
SiSoft Sandra is a theoretical multi purpose benchmark suite which is able to show differences in CPU architectures. We split the tests with SiSoft Sandra into two parts. Therefore on this page you'll find Arithmetic-, Multimedia- and Cryptograph99y-benchmarks.
Arithmetic Benchmark
| SiSoft Sandra - Arithmetic Benchmark - Dhrystone |
Review Rating |
GIPS | Percent |
| ASUS P8Z77-V |
No Review |
116.00 | 101.05 % |
| ASUS Sabertooth Z77 |
No Review |
116.00 | 101.05 % |
| ASUS P8Z77-V Deluxe |
No Review |
115.77 | 100.85 % |
| ASRock Z77 Extreme6 |
No Review |
115.61 | 100.71 % |
| ASUS Maximus V Gene |
No Review |
115.50 | 100.62 % |
| ASUS P8H77-I |
No Review |
115.42 | 100.55 % |
| ASUS P8Z77 WS |
No Review |
115.32 | 100.46 % |
| ASUS P8H77-M LE/SI |
No Review |
115.30 | 100.44 % |
| ASUS P8Z77-I Deluxe |
No Review |
115.26 | 100.41 % |
| Gigabyte Z77X-UD5H |
No Review |
115.24 | 100.39 % |
| Gigabyte Z77 G1.Sniper 3 |
No Review |
115.22 | 100.37 % |
| Biostar TZ77XE4 TOverclocker |
No Review |
115.00 | 100.18 % |
| Intel DZ77GA-70K |
No Review |
114.79 | 100.00 % |
| Gigabyte Z77MX-D3H |
No Review |
114.37 | 99.63 % |
| more is better | |||
| SiSoft Sandra - Arithmetic Benchmark - Whetstone |
Review Rating |
GFLOPS | Percent |
| ASUS Sabertooth Z77 |
No Review |
88.89 | 100.49 % |
| ASUS P8Z77 WS |
No Review |
88.82 | 100.41 % |
| ASUS P8Z77-V |
No Review |
88.78 | 100.36 % |
| ASUS Maximus V Gene |
No Review |
88.62 | 100.18 % |
| Gigabyte Z77 G1.Sniper 3 |
No Review |
88.52 | 100.07 % |
| ASUS P8H77-I |
No Review |
88.50 | 100.05 % |
| Gigabyte Z77MX-D3H |
No Review |
88.47 | 100.01 % |
| Intel DZ77GA-70K |
No Review |
88.46 | 100.00 % |
| Biostar TZ77XE4 TOverclocker |
No Review |
88.22 | 99.73 % |
| ASUS P8H77-M LE/SI |
No Review |
88.18 | 99.68 % |
| ASRock Z77 Extreme6 |
No Review |
88.00 | 99.48 % |
| ASUS P8Z77-I Deluxe |
No Review |
88.00 | 99.48 % |
| Gigabyte Z77X-UD5H |
No Review |
87.82 | 99.28 % |
| ASUS P8Z77-V Deluxe |
No Review |
87.80 | 99.25 % |
| more is better | |||
Multimedia
| SiSoft Sandra - Multimedia - Integer |
Review Rating |
MPixels/sec | Percent |
| ASUS P8Z77-V Deluxe |
No Review |
212.26 | 100.91 % |
| ASUS Sabertooth Z77 |
No Review |
212.09 | 100.83 % |
| ASUS P8Z77-V |
No Review |
212.00 | 100.78 % |
| ASRock Z77 Extreme6 |
No Review |
211.62 | 100.60 % |
| ASUS P8Z77 WS |
No Review |
211.39 | 100.49 % |
| ASUS Maximus V Gene |
No Review |
211.29 | 100.45 % |
| Gigabyte Z77 G1.Sniper 3 |
No Review |
211.27 | 100.44 % |
| Gigabyte Z77X-UD5H |
No Review |
211.13 | 100.37 % |
| ASUS P8H77-I |
No Review |
211.00 | 100.31 % |
| Gigabyte Z77MX-D3H |
No Review |
210.88 | 100.25 % |
| ASUS P8H77-M LE/SI |
No Review |
210.74 | 100.19 % |
| ASUS P8Z77-I Deluxe |
No Review |
210.63 | 100.13 % |
| Biostar TZ77XE4 TOverclocker |
No Review |
210.38 | 100.01 % |
| Intel DZ77GA-70K |
No Review |
210.35 | 100.00 % |
| more is better | |||
| SiSoft Sandra - Multimedia - Floating Point |
Review Rating |
MPixels/sec | Percent |
| ASUS Sabertooth Z77 |
No Review |
297.67 | 100.95 % |
| ASUS P8Z77-V |
No Review |
297.10 | 100.76 % |
| ASUS Maximus V Gene |
No Review |
297.10 | 100.76 % |
| ASUS P8Z77-V Deluxe |
No Review |
296.85 | 100.67 % |
| ASRock Z77 Extreme6 |
No Review |
296.59 | 100.58 % |
| Gigabyte Z77 G1.Sniper 3 |
No Review |
296.14 | 100.43 % |
| ASUS P8H77-M LE/SI |
No Review |
296.00 | 100.38 % |
| ASUS P8Z77-I Deluxe |
No Review |
295.88 | 100.34 % |
| ASUS P8H77-I |
No Review |
295.50 | 100.21 % |
| Biostar TZ77XE4 TOverclocker |
No Review |
295.48 | 100.21 % |
| ASUS P8Z77 WS |
No Review |
295.23 | 100.12 % |
| Gigabyte Z77X-UD5H |
No Review |
294.90 | 100.01 % |
| Intel DZ77GA-70K |
No Review |
294.87 | 100.00 % |
| Gigabyte Z77MX-D3H |
No Review |
294.79 | 99.97 % |
| more is better | |||
Crytography
| SiSoft Sandra - Crytography - AES 256 |
Review Rating |
GB/sec | Percent |
| ASUS P8Z77-V Deluxe |
No Review |
7.12 | 101.71 % |
| ASUS P8Z77-V |
No Review |
7.11 | 101.57 % |
| ASUS Maximus V Gene |
No Review |
7.11 | 101.57 % |
| ASUS P8Z77 WS |
No Review |
7.09 | 101.29 % |
| ASUS P8Z77-I Deluxe |
No Review |
7.08 | 101.14 % |
| ASUS Sabertooth Z77 |
No Review |
7.07 | 101.00 % |
| ASUS P8H77-M LE/SI |
No Review |
7.00 | 100.00 % |
| Gigabyte Z77 G1.Sniper 3 |
No Review |
7.00 | 100.00 % |
| ASRock Z77 Extreme6 |
No Review |
7.00 | 100.00 % |
| Intel DZ77GA-70K |
No Review |
7.00 | 100.00 % |
| Biostar TZ77XE4 TOverclocker |
No Review |
7.00 | 100.00 % |
| Gigabyte Z77X-UD5H |
No Review |
7.00 | 100.00 % |
| Gigabyte Z77MX-D3H |
No Review |
7.00 | 100.00 % |
| ASUS P8H77-I |
No Review |
6.20 | 88.57 % |
| more is better | |||
| SiSoft Sandra - Crytography - SHA 256 |
Review Rating |
GB/sec | Percent |
| ASUS P8Z77 WS |
No Review |
1.21 | 100.83 % |
| ASUS Sabertooth Z77 |
No Review |
1.21 | 100.83 % |
| ASUS P8H77-M LE/SI |
No Review |
1.20 | 100.00 % |
| Gigabyte Z77 G1.Sniper 3 |
No Review |
1.20 | 100.00 % |
| ASRock Z77 Extreme6 |
No Review |
1.20 | 100.00 % |
| ASUS P8Z77-V |
No Review |
1.20 | 100.00 % |
| ASUS Maximus V Gene |
No Review |
1.20 | 100.00 % |
| ASUS P8H77-I |
No Review |
1.20 | 100.00 % |
| ASUS P8Z77-V Deluxe |
No Review |
1.20 | 100.00 % |
| ASUS P8Z77-I Deluxe |
No Review |
1.20 | 100.00 % |
| Intel DZ77GA-70K |
No Review |
1.20 | 100.00 % |
| Biostar TZ77XE4 TOverclocker |
No Review |
1.20 | 100.00 % |
| Gigabyte Z77X-UD5H |
No Review |
1.20 | 100.00 % |
| Gigabyte Z77MX-D3H |
No Review |
1.20 | 100.00 % |
| more is better | |||
Discuss this article in the forums
[pagebreak]
SiSoft Sandra 2
At this point we deliver the values regarding Memory Bandwidth, Memory Latency as well as Memory and Cache Access.
Memory bandwidth
| SiSoft Sandra - Memory bandwidth - Integer |
Review Rating |
GB/sec | Percent |
| ASUS P8Z77-V Deluxe |
No Review |
22.07 | 101.01 % |
| ASUS P8Z77 WS |
No Review |
22.00 | 100.69 % |
| ASUS P8Z77-V |
No Review |
22.00 | 100.69 % |
| ASUS Sabertooth Z77 |
No Review |
22.00 | 100.69 % |
| ASUS Maximus V Gene |
No Review |
22.00 | 100.69 % |
| ASUS P8Z77-I Deluxe |
No Review |
21.92 | 100.32 % |
| ASUS P8H77-M LE/SI |
No Review |
21.87 | 100.09 % |
| Intel DZ77GA-70K |
No Review |
21.85 | 100.00 % |
| Gigabyte Z77X-UD5H |
No Review |
21.83 | 99.91 % |
| ASRock Z77 Extreme6 |
No Review |
21.82 | 99.86 % |
| Gigabyte Z77 G1.Sniper 3 |
No Review |
21.81 | 99.82 % |
| Biostar TZ77XE4 TOverclocker |
No Review |
21.78 | 99.68 % |
| Gigabyte Z77MX-D3H |
No Review |
21.76 | 99.59 % |
| ASUS P8H77-I |
No Review |
19.20 | 87.87 % |
| more is better | |||
| SiSoft Sandra - Memory bandwidth - floating point |
Review Rating |
GB/sec | Percent |
| ASUS P8Z77 WS |
No Review |
22.00 | 100.73 % |
| ASUS P8Z77-V |
No Review |
22.00 | 100.73 % |
| ASUS Maximus V Gene |
No Review |
22.00 | 100.73 % |
| ASUS Sabertooth Z77 |
No Review |
22.00 | 100.73 % |
| ASUS P8Z77-V Deluxe |
No Review |
22.00 | 100.73 % |
| ASUS P8Z77-I Deluxe |
No Review |
21.92 | 100.37 % |
| Biostar TZ77XE4 TOverclocker |
No Review |
21.90 | 100.27 % |
| ASUS P8H77-M LE/SI |
No Review |
21.87 | 100.14 % |
| Intel DZ77GA-70K |
No Review |
21.84 | 100.00 % |
| Gigabyte Z77X-UD5H |
No Review |
21.83 | 99.95 % |
| ASRock Z77 Extreme6 |
No Review |
21.82 | 99.91 % |
| Gigabyte Z77 G1.Sniper 3 |
No Review |
21.81 | 99.86 % |
| Gigabyte Z77MX-D3H |
No Review |
21.79 | 99.77 % |
| ASUS P8H77-I |
No Review |
19.20 | 87.91 % |
| more is better | |||
Memory latency
| SiSoft Sandra - Memory latency |
Review Rating |
ns | Percent |
| ASUS P8Z77 WS |
No Review |
21.2 | 100.94 % |
| Intel DZ77GA-70K |
No Review |
21.4 | 100.00 % |
| Biostar TZ77XE4 TOverclocker |
No Review |
21.4 | 100.00 % |
| Gigabyte Z77 G1.Sniper 3 |
No Review |
21.5 | 99.53 % |
| Gigabyte Z77X-UD5H |
No Review |
21.5 | 99.53 % |
| Gigabyte Z77MX-D3H |
No Review |
22.3 | 95.96 % |
| ASUS Sabertooth Z77 |
No Review |
23.1 | 92.64 % |
| ASUS Maximus V Gene |
No Review |
23.1 | 92.64 % |
| ASUS P8H77-M LE/SI |
No Review |
23.9 | 89.54 % |
| ASUS P8Z77-V |
No Review |
23.9 | 89.54 % |
| ASUS P8Z77-V Deluxe |
No Review |
23.9 | 89.54 % |
| ASUS P8Z77-I Deluxe |
No Review |
23.9 | 89.54 % |
| ASRock Z77 Extreme6 |
No Review |
25.6 | 83.59 % |
| ASUS P8H77-I |
No Review |
26.0 | 82.31 % |
| less is better | more is better | ||
Memory and cache access
| SiSoft Sandra - Memory and cache access |
Review Rating |
GB/sec | Percent |
| ASUS P8Z77-V Deluxe |
No Review |
120.49 | 101.01 % |
| ASUS Sabertooth Z77 |
No Review |
120.31 | 100.86 % |
| ASUS P8Z77-V |
No Review |
120.15 | 100.73 % |
| ASUS P8Z77 WS |
No Review |
119.99 | 100.60 % |
| ASUS P8H77-M LE/SI |
No Review |
119.68 | 100.34 % |
| ASUS P8Z77-I Deluxe |
No Review |
119.65 | 100.31 % |
| ASUS Maximus V Gene |
No Review |
119.56 | 100.23 % |
| Gigabyte Z77X-UD5H |
No Review |
119.39 | 100.09 % |
| ASRock Z77 Extreme6 |
No Review |
119.33 | 100.04 % |
| Intel DZ77GA-70K |
No Review |
119.28 | 100.00 % |
| Biostar TZ77XE4 TOverclocker |
No Review |
119.24 | 99.97 % |
| Gigabyte Z77MX-D3H |
No Review |
118.89 | 99.67 % |
| Gigabyte Z77 G1.Sniper 3 |
No Review |
118.52 | 99.36 % |
| ASUS P8H77-I |
No Review |
114.40 | 95.91 % |
| more is better | |||
Discuss this article in the forums
[pagebreak]
UC Bench
| UC Bench |
Review Rating |
PW/sec | Percent |
| ASUS Maximus V Gene |
No Review |
889.9 | 100.74 % |
| ASUS P8Z77-V |
No Review |
889.7 | 100.71 % |
| ASUS P8Z77-V Deluxe |
No Review |
889.8 | 100.72 % |
| ASUS P8Z77 WS |
No Review |
889.6 | 100.70 % |
| ASRock Z77 Extreme6 |
No Review |
889.1 | 100.65 % |
| ASUS Sabertooth Z77 |
No Review |
887.9 | 100.51 % |
| Gigabyte Z77X-UD5H |
No Review |
885.0 | 100.18 % |
| ASUS P8H77-I |
No Review |
885.0 | 100.18 % |
| Gigabyte Z77 G1.Sniper 3 |
No Review |
884.8 | 100.16 % |
| ASUS P8Z77-I Deluxe |
No Review |
884.8 | 100.16 % |
| Gigabyte Z77MX-D3H |
No Review |
884.8 | 100.16 % |
| Intel DZ77GA-70K |
No Review |
883.4 | 100.00 % |
| ASUS P8H77-M LE/SI |
No Review |
882.6 | 99.91 % |
| Biostar TZ77XE4 TOverclocker |
No Review |
882.5 | 99.90 % |
| more is better | |||
Discuss this article in the forums [pagebreak]
Super Pi 1M - 32M
Meanwhile Super Pi even in its latest version has become pretty old. Never the less it is able to show scaling to the clock speed nicely.
Super Pi 1M
| Super Pi 1.5 XS - 1M |
Review Rating |
sec | Percent |
| ASUS P8Z77 WS |
No Review |
10.327 | 100.76 % |
| ASUS Maximus V Gene |
No Review |
10.327 | 100.76 % |
| ASUS Sabertooth Z77 |
No Review |
10.329 | 100.75 % |
| ASUS P8Z77-V |
No Review |
10.359 | 100.45 % |
| ASRock Z77 Extreme6 |
No Review |
10.374 | 100.31 % |
| ASUS P8Z77-V Deluxe |
No Review |
10.374 | 100.31 % |
| Gigabyte Z77X-UD5H |
No Review |
10.374 | 100.31 % |
| ASUS P8Z77-I Deluxe |
No Review |
10.390 | 100.15 % |
| ASUS P8H77-I |
No Review |
10.390 | 100.15 % |
| Gigabyte Z77 G1.Sniper 3 |
No Review |
10.405 | 100.01 % |
| Intel DZ77GA-70K |
No Review |
10.406 | 100.00 % |
| Gigabyte Z77MX-D3H |
No Review |
10.406 | 100.00 % |
| ASUS P8H77-M LE/SI |
No Review |
10.420 | 99.87 % |
| Biostar TZ77XE4 TOverclocker |
No Review |
10.467 | 99.42 % |
| less is better | more is better | ||
Super Pi 32M
| Super Pi 1.5 XS - 32M |
Review Rating |
sec | Percent |
| ASUS P8Z77 WS |
No Review |
558.887 | 101.00 % |
| ASUS Maximus V Gene |
No Review |
559.714 | 100.86 % |
| ASUS P8Z77-V Deluxe |
No Review |
559.853 | 100.83 % |
| ASUS Sabertooth Z77 |
No Review |
560.384 | 100.74 % |
| ASUS P8Z77-V |
No Review |
560.868 | 100.65 % |
| Gigabyte Z77 G1.Sniper 3 |
No Review |
561.071 | 100.51 % |
| Gigabyte Z77X-UD5H |
No Review |
562.257 | 100.40 % |
| Biostar TZ77XE4 TOverclocker |
No Review |
562.771 | 100.31 % |
| Gigabyte Z77MX-D3H |
No Review |
562.959 | 100.27 % |
| Intel DZ77GA-70K |
No Review |
564.503 | 100.00 % |
| ASUS P8Z77-I Deluxe |
No Review |
564.643 | 99.98 % |
| ASUS P8H77-M LE/SI |
No Review |
564.648 | 99.97 % |
| ASRock Z77 Extreme6 |
No Review |
566.187 | 99.70 % |
| ASUS P8H77-I |
No Review |
571.429 | 98.79 % |
| less is better | more is better | ||
Discuss this article in the forums [pagebreak]
wPrime 1024M Multicore
wPrime is based on a multithreaded algorithm to calculate the square root to up to 32 billion digits. Therefore it is possible to put 100 percent load on every core or thread and to see differences between architectures.| wPrime - 1024M Multi Core |
Review Rating |
sec | Percent |
| ASUS Maximus V Gene |
No Review |
210.066 | 100.76 % |
| ASRock Z77 Extreme6 |
No Review |
210.100 | 100.74 % |
| ASUS P8Z77-V |
No Review |
210.212 | 100.69 % |
| ASUS P8Z77 WS |
No Review |
210.243 | 100.67 % |
| ASUS P8Z77-V Deluxe |
No Review |
210.334 | 100.63 % |
| ASUS Sabertooth Z77 |
No Review |
210.690 | 100.46 % |
| ASUS P8H77-I |
No Review |
211.134 | 100.25 % |
| Gigabyte Z77X-UD5H |
No Review |
211.162 | 100.24 % |
| Gigabyte Z77 G1.Sniper 3 |
No Review |
211.176 | 100.23 % |
| Gigabyte Z77MX-D3H |
No Review |
211.394 | 100.13 % |
| Intel DZ77GA-70K |
No Review |
211.659 | 100.00 % |
| ASUS P8H77-M LE/SI |
No Review |
211.992 | 99.84 % |
| Biostar TZ77XE4 TOverclocker |
No Review |
212.099 | 99.79 % |
| ASUS P8Z77-I Deluxe |
No Review |
214.123 | 98.85 % |
| less is better | more is better | ||
Discuss this article in the forums
[pagebreak]
Games
Crysis 800 x 600, low details
Crysis is still one of the games which has very high system requirements. Therefore developer Crytek implemented Direct3D-10-API, High-Dynamic-Range-Rendering, Parallax Occlusion Mapping, Soft Shadows, Motion Blur, Depth of Field as well as Soft Particles. We test Crysis by using DirectX9 to show CPU-sacaling especially which low resolutions. If we look at the high resolutions we are able to spot that the CPUs influence compared to the graphic card becomes much less important.
| Crysis DirectX10 (800 x 600 low details) |
Review Rating |
fps | Percent |
| ASUS P8Z77-I Deluxe |
No Review |
179.14 | 107.71 % |
| ASUS P8H77-I |
No Review |
173.23 | 104.15 % |
| ASUS P8Z77 WS |
No Review |
168.11 | 101.08 % |
| Gigabyte Z77MX-D3H |
No Review |
167.32 | 100.60 % |
| Gigabyte Z77X-UD5H |
No Review |
167.05 | 100.44 % |
| Intel DZ77GA-70K |
No Review |
166.32 | 100.00 % |
| ASUS Maximus V Gene |
No Review |
165.97 | 99.79 % |
| Gigabyte Z77 G1.Sniper 3 |
No Review |
165.66 | 99.60 % |
| ASUS P8Z77-V |
No Review |
165.00 | 99.21 % |
| ASUS P8Z77-V Deluxe |
No Review |
163.91 | 98.55 % |
| ASUS Sabertooth Z77 |
No Review |
162.97 | 97.99 % |
| Biostar TZ77XE4 TOverclocker |
No Review |
162.32 | 97.59 % |
| ASUS P8H77-M LE/SI |
No Review |
162.20 | 97.52 % |
| ASRock Z77 Extreme6 |
No Review |
160.72 | 96.63 % |
| more is better | |||
Resident Evil 800 x 600, low details
Resident Evil uses nearly every modern rendering technology: HDR, Hemisphere Lighting, Soft Shadows, Soft Particles, Field- und Motion-Blur oder auch Alpha to Coverage and static Ambient Occlusion. Furthermore Resident Evil 5 has been optimized for multicore architectures and already comes DirectX11 ready. By using the DirectX9 benchmark we can again show CPU-scaling with low resolutions and the compared to the CPU overproportional influence of the graphics card at high resolutions.
| Resident Evil DirectX10 (800 x 600 low details) |
Review Rating |
fps | Percent |
| Intel DZ77GA-70K |
No Review |
221.4 | 100.00 % |
| Gigabyte Z77 G1.Sniper 3 |
No Review |
219.5 | 99.14 % |
| ASUS P8Z77-V Deluxe |
No Review |
218.7 | 98.78 % |
| ASUS Sabertooth Z77 |
No Review |
218.5 | 98.69 % |
| ASUS P8Z77-V |
No Review |
217.7 | 98.33 % |
| ASRock Z77 Extreme6 |
No Review |
215.7 | 97.43 % |
| Biostar TZ77XE4 TOverclocker |
No Review |
215.7 | 97.43 % |
| Gigabyte Z77MX-D3H |
No Review |
215.7 | 97.43 % |
| Gigabyte Z77X-UD5H |
No Review |
213.2 | 96.30 % |
| ASUS P8H77-M LE/SI |
No Review |
212.6 | 96.03 % |
| ASUS P8Z77-I Deluxe |
No Review |
211.9 | 95.71 % |
| ASUS Maximus V Gene |
No Review |
211.6 | 95.57 % |
| ASUS P8Z77 WS |
No Review |
207.7 | 93.81 % |
| ASUS P8H77-I |
No Review |
207.2 | 93.59 % |
| more is better | |||
Street Fighter 4 800 x 600, low details
Street Fighter 4 comes with an extra benchmark version which makes testing you system childrens play. At low resolutions the system requirements are pretty low and we can see CPU-scaling in the results. At high resolution the graphic card becomes more important and the CPUs clock speed has less influence on the fps.
| Street Fighter 4 (800 x 600 low details) |
Review Rating |
fps | Percent |
| Gigabyte Z77X-UD5H |
No Review |
832.85 | 106.43 % |
| ASUS P8Z77 WS |
No Review |
808.12 | 103.27 % |
| Biostar TZ77XE4 TOverclocker |
No Review |
806.81 | 103.11 % |
| Gigabyte Z77 G1.Sniper 3 |
No Review |
803.92 | 102.74 % |
| ASUS P8Z77-V Deluxe |
No Review |
802.43 | 102.55 % |
| ASUS P8Z77-V |
No Review |
802.37 | 102.54 % |
| ASUS P8Z77-I Deluxe |
No Review |
801.05 | 102.37 % |
| ASUS Maximus V Gene |
No Review |
797.67 | 101.94 % |
| ASUS Sabertooth Z77 |
No Review |
795.52 | 101.66 % |
| ASUS P8H77-M LE/SI |
No Review |
789.76 | 100.93 % |
| Gigabyte Z77MX-D3H |
No Review |
783.26 | 100.10 % |
| Intel DZ77GA-70K |
No Review |
782.50 | 100.00 % |
| ASRock Z77 Extreme6 |
No Review |
780.76 | 99.78 % |
| ASUS P8H77-I |
No Review |
766.45 | 97.95 % |
| more is better | |||
Discuss this article in the forums
[pagebreak]
Power Consumption
Idle
| Idle |
Review Rating |
Watt | Percent |
| ASUS P8H77-I |
No Review |
84 | 123.81 % |
| ASUS P8Z77-I Deluxe |
No Review |
90 | 115.56 % |
| ASUS P8Z77-V |
No Review |
93 | 111.83 % |
| ASUS P8H77-M LE/SI |
No Review |
94 | 110.64 % |
| ASRock Z77 Extreme6 |
No Review |
96 | 108.33 % |
| Gigabyte Z77MX-D3H |
No Review |
98 | 106.12 % |
| Biostar TZ77XE4 TOverclocker |
No Review |
98 | 106.12 % |
| ASUS Sabertooth Z77 |
No Review |
100 | 104.00 % |
| ASUS P8Z77-V Deluxe |
No Review |
101 | 102.97 % |
| ASUS Maximus V Gene |
No Review |
102 | 101.96 % |
| Intel DZ77GA-70K |
No Review |
104 | 100.00 % |
| Gigabyte Z77X-UD5H |
No Review |
110 | 94.55 % |
| Gigabyte Z77 G1.Sniper 3 |
No Review |
114 | 91.23 % |
| ASUS P8Z77 WS |
No Review |
118 | 88.14 % |
| more is better | more is better | ||
Load
| Load |
Review Rating |
Watt | Percent |
| ASUS P8H77-I |
No Review |
136 | 108.82 % |
| ASUS P8Z77-I Deluxe |
No Review |
137 | 108.03 % |
| ASRock Z77 Extreme6 |
No Review |
138 | 107.25 % |
| ASUS P8H77-M LE/SI |
No Review |
138 | 107.25 % |
| Biostar TZ77XE4 TOverclocker |
No Review |
142 | 104.23 % |
| ASUS Maximus V Gene |
No Review |
144 | 102.78 % |
| ASUS P8Z77-V |
No Review |
145 | 102.07 % |
| Gigabyte Z77MX-D3H |
No Review |
146 | 101.37 % |
| ASUS Sabertooth Z77 |
No Review |
147 | 100.68 % |
| Intel DZ77GA-70K |
No Review |
148 | 100.00 % |
| ASUS P8Z77-V Deluxe |
No Review |
149 | 99.33 % |
| Gigabyte Z77X-UD5H |
No Review |
151 | 98.01 % |
| Gigabyte Z77 G1.Sniper 3 |
No Review |
155 | 95.48 % |
| ASUS P8Z77 WS |
No Review |
163 | 90.80 % |
| less is better | more is better | ||
Discuss this article in the forums
[pagebreak]
Performance Rating
| 3D and Gaming Benchmarks |
Review Rating |
Percent |
| ASUS P8Z77-I Deluxe |
No Review |
101.10 % |
| Gigabyte Z77X-UD5H |
No Review |
100.40 % |
| ASUS P8Z77-V |
No Review |
100.28 % |
| ASUS Maximus V Gene |
No Review |
100.21 % |
| ASUS Sabertooth Z77 |
No Review |
100.21 % |
| ASUS P8Z77 WS |
No Review |
100.15 % |
| Gigabyte Z77MX-D3H |
No Review |
100.14 % |
| ASUS P8Z77-V Deluxe |
No Review |
100.13 % |
| Intel DZ77GA-70K |
No Review |
100.00 % |
| Gigabyte Z77 G1.Sniper 3 |
No Review |
99.97 % |
| Biostar TZ77XE4 TOverclocker |
No Review |
99.65 % |
| ASRock Z77 Extreme6 |
No Review |
99.27 % |
| ASUS P8H77-M LE/SI |
No Review |
99.19 % |
| ASUS P8H77-I |
No Review |
98.97 % |
| more is better | ||
| 2D Benchmarks |
Review Rating |
Percent |
| ASUS P8Z77 WS |
No Review |
100.40 % |
| Gigabyte Z77 G1.Sniper 3 |
No Review |
100.10 % |
| ASUS Maximus V Gene |
No Review |
100.01 % |
| ASUS Sabertooth Z77 |
No Review |
100.04 % |
| Intel DZ77GA-70K |
No Review |
100.00 % |
| Gigabyte Z77X-UD5H |
No Review |
99.98 % |
| Biostar TZ77XE4 TOverclocker |
No Review |
99.92 % |
| ASUS P8Z77-V |
No Review |
99.84 % |
| ASUS P8Z77-V Deluxe |
No Review |
99.82 % |
| Gigabyte Z77MX-D3H |
No Review |
99.78 % |
| ASUS P8Z77-I Deluxe |
No Review |
99.58 % |
| ASUS P8H77-M LE/SI |
No Review |
99.26 % |
| ASRock Z77 Extreme6 |
No Review |
99.21 % |
| ASUS P8H77-I |
No Review |
96.73 % |
| more is better | ||
| Performance per Watt |
Review Rating |
Percent |
| ASUS P8H77-I |
No Review |
84.13 % |
| ASUS P8Z77-I Deluxe |
No Review |
89.75 % |
| ASUS P8H77-M LE/SI |
No Review |
91.08 % |
| ASRock Z77 Extreme6 |
No Review |
92.07 % |
| ASUS P8Z77-V |
No Review |
93.56 % |
| Biostar TZ77XE4 TOverclocker |
No Review |
94.88 % |
| Gigabyte Z77MX-D3H |
No Review |
96.35 % |
| ASUS Maximus V Gene |
No Review |
97.79 % |
| ASUS Sabertooth Z77 |
No Review |
97.84 % |
| ASUS P8Z77-V Deluxe |
No Review |
98.84 % |
| Intel DZ77GA-70K |
No Review |
100.00 % |
| Gigabyte Z77X-UD5H |
No Review |
104.06 % |
| Gigabyte Z77 G1.Sniper 3 |
No Review |
107.16 % |
| ASUS P8Z77 WS |
No Review |
112.77 % |
| less is better | ||
Discuss this article in the forums [pagebreak]
Conclusion
| Allgemein | + | - | |
| The Gigabyte Z77X-UD5H-WB WiFi leaves a good impression and so far we really like it. Opening the box shows a good delivery. There really is everything you need. With the WiFi card there even is a nice addition which enables wireless connectivity. Generally this is a nice looking board which also comes with many overclocking features. There are for example voltage readout point, power, reset and CLR COMS button. Overall this is a really versatile board. | - Layout - Bundle - Design |
||
| Layout | + | - | |
|
Generally the Gigabyte Z77X-UD5H-WB WiFi has been very well thought regarding the layout. You will find everything that is practical and useful like for example reset/power/clear_cmos buttons as well as a BIOS switch, voltage reading points, a Debug LED Post Code display. Once more practical are also the angled SATA connectors and finally one legacy PCI slot which can still be very useful nowadays. Furthermore we found two PCI Express x1 slots below the first full size PCI Express slot. If you should think about an SLI or CrossFire setup the cards will be well ventilated. |
- SLI/CrossFireX - Onboard buttons - Debug LED Post Code - Voltage reading points - Legacy PCI - HDMI/VGA/DVI/DisplayPort |
- no PS/2 | |
| Performance | + | - | |
| With the Z77X-UD5H-WB WiFi, Gigabyte has a motherboard in its portfolio, which shows very solid benchmark results. The performance was very good concerning 3D Mark Vantage and Streetfighter. Furthermore there are no performance glitches, which is makes this board perform consitently in a wide variety of benchmarks. A closer look at the power consumption on the other hand shows that this is a board with a lot of features onboard. High power consumption is typical for motherboards with many features. Therefore it is no surprise that you can find this board almost at the bottom of our comparison tables when it comes to power consumption. | -
3D Mark Vantage - StreetFighter |
||
| BIOS / Overclocking | + | - | |
| Also in the overclocking part the Z77X-UD5H-WB WiFi was a very convincing product. Therefore it's been childrens play to reach the clock wall of our test CPU. Furthermore the UEFI BIOS is very easy to use and one can quickly find the settings needed. Gigabyte really made it's homework and nowadays usability is very good. Also compared to the competition. Gigabyte chose an individual approach and in our opinion, they succeeded. | - Well structured BIOS - UEFI-BIOS | ||
| Recommendation | + | - | |
| If you want to build a end comptuer or a gaming system, which is based on Intels Ivy Bridge CPU then the Z77X-UD5H-WB WiFi is definitely a good choice. | - High-End - Gaming - Overclocking |
||
| Rating | |||
| We give the Z77X-UD5H-WB WiFi good four out of five stars. | |||

Discuss this article in the forums
Author: m.buechel@ocaholic.ch Copy edited and translated: m.buechel@ocaholic.ch c.ney@ocaholic.ch