 The X99 OC Formula is ASRock's new high-end motherboard when it comes to overclocking Intel's latest HEDT Haswell-E processors. But this board is not only interesting for overclockers. Gamers for example will enjoy the beefed up audio solution with decent headphone amp. What you also get with this board is ASRocks "Conformal Coating", which basically makes it waterproof. Especially extreme overclockers do love this feature. Overall we're really curious about this motherboard. ASRock has been investing quite some extra time in crafting the X99 OC Formula and now we really want to know what it can do.
 Article in English Article in English |
 Artikel in Deutsch Artikel in Deutsch |
 Article en français Article en français |
 Articolo in italiano Articolo in italiano |

The X99 OC Formula is ASRock's latest and greatest high-end overclocking motherboard regarding Intels latest X99 chipset. Therefore we're really curious what they've come up with from the layout and design as well as performance and features.
Specs and Delivery
| Chipset | Intel X99 |
| Memory | Quad Channel DDR4, 8 x DIMM, Max. 128 GB DDR3, 3400+(OC) / 2933(OC) / 2800(OC) / 2400(OC) / 2133 / 1866 Non-ECC, Un-buffered Memory |
| Multi-GPU |
|
| Slots |
|
| Sound | Realtek ALC1150
|
| Storage |
|
| Network |
|
| Internal Connectors |
|
| Extrenal Connectors |
|
| Forfactor | EATX (30.5cm x 30.0cm) |
| BIOS | Bios (128 Mb flash ROM, UEFI AMI BIOS) |


- 3 x ASRock Flexible SLI Bridge Connector Cables (2 x 10 cm, 1 x 14 cm)
- Quick Installation Guide, Support CD, I/O Shield
- 6 x SATA Data Cables
- 1 x HDD Saver Cable
- 2 x Screws for M.2 Sockets
- 1 x Screw for mini-PCIe Slot
Features
12 + 4 Phase Power Design |
Since quite some time ASRock has been equipping its boards with digital power designs. With the OC Formula they are very proud about their quite complex solution which consists of Dual-Stack MOSFET's (DSM), NexFET MOSFETs and 12K Platinum caps. |
|
Purity SoundTM 2 |
The ASRock Purity 2 audio solution is based on a Realtek ALC1150 audio codec and features 115dB SNR. It also comes with EMI shielding for the main chip as well as onboard isolation. In order to improve signal quality, the motherboard features excellent Nichicon onboard capacitors. |
 |
M.2 Support |
The new OC Formula motherboard from ASRock features two M.2 slots. Both have been placed in between full-size PCIe slots. The first slot is connected via two Gen2 lanes offering up to 10Gbps bandwidth. The second slot is connected via four Gen3 lanes and therefore offers up to 32Gbps bandwidth and is therefore more than five times faster than a SATA-III port. |
 |
NickShih's OC Profile |
Overclockers might be aware that it can take ages until ideal settings have been found. For this purpose NickShih, who is ASRocks product manager for this board, already prepared different presets. These presets actually make the life of any overclocker much easier, no matter if he's experienced or not. |

|
Rapid OC |
What you get with this feature are two buttons, which have been placed on the motherboard directly. Their purpose is to make overclocking even easier. In fact you can change the multiplyer, BCLK as well as VCore by simply pressing the plus or minus button. |
 |
Conformal Coating |
Conformal Coating is a special layer, which prevents shortcuts when spilling water or other conductive liquids over the motherboard. In this case overclockers won't have to worry anymore about accidentally spilling liquid nitrogen over the board while overclocking. |
 |

Layout
At a first glance the ASRock OC Formula leaves a very good impression with its harmonic design. The manufacturer decided to go for a combination of black, yellow and gold, which suites nicely and in the end you get an aesthetic although aggressive looking product. The layout itself is well thought and there is for example plenty of space around the CPU socket to install even todays largest CPU coolers. The fact that there are SATA connectors which have been angled by 90 degrees allow for an easy installation of oversized graphics cards. It's quite striking to see how similar the new X99 OC Formula is compared to the Z97 OC Formula. Apparently ASRock seems to have found a working formula, which they don't need to change by too much regarding design.The ASRock OC Formula comes with a digital 12 phase power design. Like we've already explained on the features page ASRock is making use of an extensive solution. There are for instance Dual N-channel MOSFETs as well as 12K Platinum caps on this motherboard. The 12K Platinum caps are made by Nichicon and therefore extremely high-end. Overall it becomes clear, that one of this boards most important features is the power design.

Totally you'll find eight DIMM-slots on the ASRock X99 OC Formula. Officially supported are memory clock speeds of up to DDR4-3400MHz. Should you choose to equip all slots with 8 GB modules, you can have a maximum of 64 GB memory on this motherboard. There is also enough space around the CPU socket, to install large CPU coolers.

On the OC Formula PCH as well as current converters got separate cooling blocks. In case of the southbridge there is a single block made from aluminium, which provides adequate cooling. A closer look at the current converters shows that there are two individual blocks connected to one another by a heatpipe. We're happy to see that ASRock didn't equip this board with an additional fan. Other than that the weight of this board is astonishingly high, which gives a solid hint on the build quality of the cooling blocks.


Connectors and I/O
Totally ASRock equipped the OC Formula with no less then ten
angled SATA ports. Apart from that there is also a M.2 slot, which offers up to
10Gbps bandwith and there is even another M.2 slot which has offers up to 32Gbps
bandwidth since it is connected through four Gen3 lanes. These storage
connectors are definitely enough for any gaming system
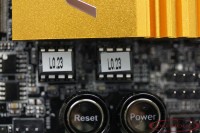
or overclocking setup. You'll also find practical onboard power- and
reset-buttons in the bottom left corner of the board as well as a debug
display. Furthermore there are also voltage read out points as well as ASRocks
Rapid-OC buttons which allow an overclocker to change the multiplyer, BLCK as
well as voltages on the fly.
Similar to the Z97 OC Formula the X99 OC Formula features a Realtek
ALC1150 chip with an EMI shielding cap on top of it. Furthermore this chip has
been isolated from the rest of the board to reduce signalnoise and improve
signal quality. Additionally there is a high quality headphone amplifier, which
is capable of driving headphones and headsets with high impedances. Apart from
that there are even high quality Nichicon audio capacitors to further improve
signal quality.


Totally you'll find six fan header on the OC Formula which is more than enough, to provide a well equipped high-end or overclocking-system with fresh air. The fan headers are located around the CPU socket as spread over the motherboard.

Looking at the external connectors at the back-panel ASRock equipped the X99 OC Formula with six USB 3.0 ports, two USB 2.0 ports and two Gigabit ethernet ports. Furthermore there is an analogue audio panel as well as a digital audio out and a clear CMOS button.

BIOS
With the most recent version of ASRock's UEFI BIOS, we find it visually more attractive than what you got with the predecessor, since it's not that flashy anymore. In terms of functionality you can not only monitor system information, CPU and motherboard temperature, CPU voltage and DRAM status but you can also create your own fan profiles for the different PWM headers and you can even send all settings to a single favorite page. This is very useful for overclockers for example when they need only some voltage or memory timing settings. Other than that ASRock has been working on the overclocking options, meaning they've added new memory and CPU profiles to this motherboard. This helps making memory and CPU overclocking quite a bit easier and improves compatiblity in general.


Test setup
Hardware |
|
| Motherboard |
|
| Processor | Intel Core i7-5960X, 3.5 GHz |
| Memory | 16 GB (4x4) G.Skill Ripjaws4 DDR4-2133 MHz CL15-15-15-35-2T tRFC = 350 Rest all Auto |
| Graphic card | ASUS GeForce GTX 780 Ti Matrix Platinum |
| Driver | ForceWare 340.52 |
| Hard disk | OCZ Arc 100 SSD 240 GB |
| Power supply | Seasonic Platinum 1050W |
Preview / Gallery


3DMark
Ice Storm Extreme
| 3DMark Ice Storm Extreme Score |
Review Rating |
Percent | |
| ASUS X99 Deluxe |
 |
160'789 | 102.18 % |
| ASUS Rampage V Extreme |
|
159'987 | 101.67 % |
| ASRock X99 WS |
 |
159'888 | 101.60 % |
| ASRock X99 OC Formula |
|
159'688 | 101.48 % |
| Gigabyte X99-SOC Force |
|
159'514 | 101.37 % |
| ASUS X99-A |
|
159'157 | 101.14 % |
| ASRock X99 Extreme6 |
|
158'658 | 100.82 % |
| MSI X99S MPower |
|
158'442 | 100.68 % |
| Gigabyte X99-UD4 |
|
158'099 | 100.47 % |
| EVGA X99 Classified |
 |
157'365 | 100.00 % |
| more is better | |||
Ice Storm Physics
| 3DMark Ice Storm Physics Score |
Review Rating |
Percent | |
| ASRock X99 OC Formula |
|
59'720 | 102.28 % |
| Gigabyte X99-UD4 |
|
59'653 | 102.16 % |
| ASUS Rampage V Extreme |
|
59'650 | 102.16 % |
| ASUS X99-A |
|
59'636 | 102.14 % |
| ASUS X99 Deluxe |
|
59'635 | 102.13 % |
| ASRock X99 WS |
|
59'580 | 102.04 % |
| Gigabyte X99-SOC Force |
|
59'548 | 101.98 % |
| MSI X99S MPower |
|
59'512 | 101.92 % |
| ASRock X99 Extreme6 |
|
59'428 | 101.78 % |
| EVGA X99 Classified |
|
58'389 | 100.00 % |
| more is better | |||
Fire Strike Extreme
| 3DMark Fire Strike Score |
Review Rating |
Percent | |
| ASUS Rampage V Extreme |
|
5'533 | 100.56 % |
| ASRock X99 OC Formula |
|
5'532 | 100.55 % |
| MSI X99S MPower |
|
5'531 | 100.53 % |
| ASRock X99 Extreme6 |
|
5'530 | 100.51 % |
| ASUS X99 Deluxe |
|
5'528 | 100.47 % |
| Gigabyte X99-SOC Force |
|
5'528 | 100.47 % |
| ASRock X99 WS |
|
5'526 | 100.44 % |
| Gigabyte X99-UD4 |
|
5'516 | 100.25 % |
| EVGA X99 Classified |
|
5'502 | 100.00 % |
| ASUS X99-A |
|
5'498 | 99.93 % |
| more is better | |||
Fire Strike Physics
| 3DMark Fire Strike Physics Score |
Review Rating |
Percent | |
| ASUS Rampage V Extreme |
|
17'227 | 104.49 % |
| ASRock X99 Extreme6 |
|
17'217 | 104.43 % |
| ASUS X99 Deluxe |
|
17'168 | 104.13 % |
| MSI X99S MPower |
|
17'166 | 104.12 % |
| ASRock X99 WS |
|
17'160 | 104.08 % |
| ASRock X99 OC Formula |
|
17'156 | 104.06 % |
| Gigabyte X99-SOC Force |
|
17'142 | 103.97 % |
| ASUS X99-A |
|
17'133 | 103.92 % |
| Gigabyte X99-UD4 |
|
17'100 | 100.72 % |
| EVGA X99 Classified |
|
16'487 | 100.00 % |
| more is better | |||
3DMark 11
| 3DMark 11 Total |
Review Rating |
Percent | |
| ASRock X99 OC Formula |
|
15'988 | 103.87 % |
| ASUS X99 Deluxe |
|
15'947 | 103.61 % |
| ASUS Rampage V Extreme |
|
15'922 | 103.44 % |
| ASUS X99-A |
|
15'898 | 103.29 % |
| ASRock X99 WS |
|
15'777 | 102.50 % |
| ASRock X99 Extreme6 |
|
15'756 | 102.36 % |
| Gigabyte X99-SOC Force |
|
15'741 | 102.27 % |
| Gigabyte X99-UD4 |
|
15'652 | 101.69 % |
| MSI X99S MPower |
|
15'455 | 100.41 % |
| EVGA X99 Classified |
|
15'392 | 100.00 % |
| more is better | |||
CPU
| 3DMark 11 Physics |
Review Rating |
Percent | |
| ASUS Rampage V Extreme |
|
16'329 | 107.07 % |
| ASRock X99 OC Formula |
|
16'279 | 106.74 % |
| ASRock X99 Extreme6 |
|
16'132 | 105.78 % |
| ASUS X99-A |
|
16'070 | 105.37 % |
| ASUS X99 Deluxe |
|
15'445 | 101.27 % |
| ASRock X99 WS |
|
15'397 | 100.96 % |
| Gigabyte X99-SOC Force |
|
15'293 | 100.28 % |
| MSI X99S MPower |
|
15'280 | 100.19 % |
| EVGA X99 Classified |
|
15'251 | 100.00 % |
| Gigabyte X99-UD4 |
|
15'212 | 99.74 % |
| more is better | |||
3DMark Vantage
| 3DMark Vantage Total |
Review Rating |
Percent | |
| ASUS Rampage V Extreme |
|
50'220 | 102.51 % |
| ASRock X99 OC Formula |
|
50'187 | 102.45 % |
| ASUS X99-A |
|
50'081 | 102.23 % |
| ASUS X99 Deluxe |
|
50'050 | 102.17 % |
| Gigabyte X99-SOC Force |
|
49'843 | 101.75 % |
| ASRock X99 Extreme6 |
|
49'836 | 101.73 % |
| ASRock X99 WS |
|
49'828 | 101.71 % |
| MSI X99S MPower |
|
49'800 | 101.66 % |
| Gigabyte X99-UD4 |
|
49'756 | 101.57 % |
| EVGA X99 Classified |
|
48'988 | 100.00 % |
| more is better | |||
| 3DMark Vantage CPU |
Review Rating |
Percent | |
| ASUS Rampage V Extreme |
|
51'564 | 102.61 % |
| ASUS X99 Deluxe |
|
51'363 | 102.21 % |
| ASRock X99 OC Formula |
|
51'299 | 102.09 % |
| ASRock X99 WS |
|
51'257 | 102.00 % |
| Gigabyte X99-SOC Force |
|
51'167 | 101.82 % |
| ASRock X99 Extreme6 |
|
51'163 | 101.82 % |
| MSI X99S MPower |
|
51'102 | 101.70 % |
| ASUS X99-A |
|
51'073 | 101.64 % |
| Gigabyte X99-UD4 |
|
50'899 | 101.29 % |
| EVGA X99 Classified |
|
50'250 | 100.00 % |
| more is better | |||
PC Mark 08
Total
| PC Mark 08 Total |
Review Rating |
Percent | |
| ASUS Rampage V Extreme |
|
4'437 | 103.98 % |
| ASRock X99 OC Formula |
|
4'404 | 103.21 % |
| ASUS X99 Deluxe |
|
4'402 | 103.16 % |
| ASRock X99 WS |
|
4'399 | 103.09 % |
| ASRock X99 Extreme6 |
|
4'398 | 103.07 % |
| Gigabyte X99-SOC Force |
|
4'398 | 103.07 % |
| Gigabyte X99-UD4 |
|
4'390 | 102.88 % |
| MSI X99S MPower |
|
4'389 | 102.86 % |
| ASUS X99-A |
|
4'388 | 102.84 % |
| EVGA X99 Classified |
|
4'267 | 100.00 % |
| more is better | |||
| Web browsing - JunglePin |
Review Rating |
s | Percent |
| EVGA X99 Classified |
|
0.262 | 100.00 % |
| ASRock X99 Extreme6 |
|
0.288 | 90.97 % |
| ASRock X99 OC Formula |
|
0.288 | 90.97 % |
| ASRock X99 WS |
|
0.288 | 90.97 % |
| ASUS X99-A |
|
0.288 | 90.97 % |
| ASUS Rampage V Extreme |
|
0.288 | 90.97 % |
| ASUS X99 Deluxe |
|
0.288 | 90.97 % |
| Gigabyte X99-SOC Force |
|
0.288 | 90.97 % |
| Gigabyte X99-UD4 |
|
0.288 | 90.97 % |
| MSI X99S MPower |
|
0.288 | 90.97 % |
| less is better | |||
| Web Browsing Amazonia |
Review Rating |
s | Percent |
| ASRock X99 Extreme6 |
|
0.122 | 100.00 % |
| ASRock X99 OC Formula |
|
0.122 | 100.00 % |
| ASRock X99 WS |
|
0.122 | 100.00 % |
| ASUS X99-A |
|
0.122 | 100.00 % |
| ASUS X99 Deluxe |
|
0.122 | 100.00 % |
| ASUS Rampage V Extreme |
|
0.122 | 100.00 % |
| EVGA X99 Classified |
|
0.122 | 100.00 % |
| Gigabyte X99-SOC Force |
|
0.122 | 100.00 % |
| Gigabyte X99-UD4 |
|
0.122 | 100.00 % |
| MSI X99S MPower |
|
0.122 | 100.00 % |
| less is better | |||
| Writing |
Review Rating |
s | Percent |
| ASRock X99 WS |
|
4.08 | 107.60 % |
| Gigabyte X99-UD4 |
|
4.11 | 106.81 % |
| ASUS X99-A |
|
4.12 | 106.55 % |
| Gigabyte X99-SOC Force |
|
4.22 | 104.03 % |
| ASRock X99 OC Formula |
|
4.33 | 101.39 % |
| ASRock X99 Extreme6 |
|
4.33 | 101.39 % |
| ASUS Rampage V Extreme |
|
4.33 | 101.39 % |
| MSI X99S MPower |
|
4.35 | 100.46 % |
| ASUS X99 Deluxe |
|
4.35 | 100.46 % |
| EVGA X99 Classified |
|
4.39 | 100.00 % |
| less is better | |||
| Photo Editing |
Review Rating |
s | Percent |
| ASUS X99 Deluxe |
|
0.283 | 127.67 % |
| ASRock X99 OC Formula |
|
0.283 | 127.67 % |
| ASRock X99 WS |
|
0.283 | 127.67 % |
| ASUS Rampage V Extreme |
|
0.282 | 127.66 % |
| ASRock X99 Extreme6 |
|
0.286 | 125.87 % |
| Gigabyte X99-SOC Force |
|
0.286 | 125.87 % |
| ASUS X99-A |
|
0.306 | 117.68 % |
| MSI X99S MPower |
|
0.306 | 117.68 % |
| Gigabyte X99-UD4 |
|
0.306 | 117.68 % |
| EVGA X99 Classified |
|
0.360 | 100.00 % |
| less is better | |||
| Video Chat encoding / Video Chat Playback 1 |
Review Rating |
fps | Percent |
| ASRock X99 Extreme6 |
|
30.00 | 100.00 % |
| ASRock X99 OC Formula |
|
30.00 | 100.00 % |
| ASRock X99 WS |
|
30.00 | 100.00 % |
| ASUS X99-A |
|
30.00 | 100.00 % |
| ASUS X99 Deluxe |
|
30.00 | 100.00 % |
| ASUS Rampage V Extreme |
|
30.00 | 100.00 % |
| EVGA X99 Classified |
|
30.00 | 100.00 % |
| Gigabyte X99-SOC Force |
|
30.00 | 100.00 % |
| Gigabyte X99-UD4 |
|
30.00 | 100.00 % |
| MSI X99S MPower |
|
30.00 | 100.00 % |
| more is better | |||
| Video Chat encoding / Video Chat encoding |
Review Rating |
ms | Percent |
| ASRock X99 OC Formula |
|
42.00 | 102.62 % |
| ASRock X99 WS |
|
42.00 | 102.62 % |
| ASUS X99 Deluxe |
|
42.00 | 102.62 % |
| ASUS X99-A |
|
42.00 | 102.62 % |
| Gigabyte X99-SOC Force |
|
42.00 | 102.62 % |
| Gigabyte X99-UD4 |
|
42.00 | 102.62 % |
| MSI X99S MPower |
|
42.00 | 102.62 % |
| EVGA X99 Classified |
|
43.00 | 100.23 % |
| ASRock X99 Extreme6 |
|
43.00 | 100.23 % |
| ASUS Rampage V Extreme |
|
43.10 | 99.76 % |
| less is better | |||
| Casual Gaming |
Review Rating |
fps | Percent |
| ASUS X99 Deluxe |
|
110.1 | 101.10 % |
| ASRock X99 OC Formula |
|
109.8 | 100.83 % |
| ASUS Rampage V Extreme |
|
109.7 | 100.73 % |
| ASRock X99 WS |
|
109.6 | 100.64 % |
| Gigabyte X99-SOC Force |
|
109.4 | 100.46 % |
| EVGA X99 Classified |
|
108.9 | 100.00 % |
| ASRock X99 Extreme6 |
|
108.7 | 99.82 % |
| MSI X99S MPower |
|
108.5 | 99.63 % |
| Gigabyte X99-UD4 |
|
108.4 | 99.54 % |
| ASUS X99-A |
|
108.3 | 99.45 % |
| more is better | |||
SiSoft Sandra 1
Arithmetic Benchmark
| SiSoft Sandra - Arithmetic Benchmark - Dhrystone |
Review Rating |
GIPS | Percent |
| ASRock X99 WS |
|
241.37 | 100.37 % |
| Gigabyte X99-UD4 |
|
241.24 | 100.31 % |
| ASRock X99 OC Formula |
|
240.90 | 100.17 % |
| Gigabyte X99-SOC Force |
|
240.83 | 100.14 % |
| ASUS X99 Deluxe |
|
240.80 | 100.13 % |
| ASRock X99 Extreme6 |
|
240.70 | 100.09 % |
| ASUS Rampage V Extreme |
|
240.69 | 100.08 % |
| MSI X99S MPower |
|
240.68 | 100.08 % |
| EVGA X99 Classified |
|
240.49 | 100.00 % |
| ASUS X99-A |
|
238.68 | 99.25 % |
| more is better | |||
| SiSoft Sandra - Arithmetic Benchmark - Whetstone |
Review Rating |
GFLOPS | Percent |
| ASRock X99 WS |
|
190.29 | 100.44 % |
| ASUS X99 Deluxe |
|
190.28 | 100.43 % |
| ASUS Rampage V Extreme |
|
189.70 | 100.13 % |
| ASRock X99 OC Formula |
|
189.69 | 100.07 % |
| Gigabyte X99-SOC Force |
|
189.69 | 100.07 % |
| ASRock X99 Extreme6 |
|
189.49 | 100.02 % |
| EVGA X99 Classified |
|
189.46 | 100.00 % |
| MSI X99S MPower |
|
189.22 | 99.87 % |
| ASUS X99-A |
|
186.91 | 98.67 % |
| Gigabyte X99-UD4 |
|
186.84 | 98.66 % |
| more is better | |||
Multimedia
| SiSoft Sandra - Multimedia - Integer |
Review Rating |
MPixels/sec | Percent |
| ASUS X99 Deluxe |
|
452.13 | 105.10 % |
| ASRock X99 WS |
|
451.88 | 105.04 % |
| ASRock X99 OC Formula |
|
451.34 | 104.92 % |
| MSI X99S MPower |
|
451.26 | 104.90 % |
| ASUS Rampage V Extreme |
|
451.25 | 104.90 % |
| ASUS X99-A |
|
446.55 | 103.81 % |
| Gigabyte X99-SOC Force |
|
446.47 | 103.79 % |
| ASRock X99 Extreme6 |
|
443.38 | 103.07 % |
| Gigabyte X99-UD4 |
|
442.67 | 102.90 % |
| EVGA X99 Classified |
|
430.18 | 100.00 % |
| more is better | |||
| SiSoft Sandra - Multimedia - Floating Point |
Review Rating |
MPixels/sec | Percent |
| ASRock X99 OC Formula |
|
446.74 | 104.93 % |
| ASRock X99 WS |
|
446.68 | 104.92 % |
| ASUS Rampage V Extreme |
|
446.67 | 104.92 % |
| Gigabyte X99-SOC Force |
| >
446.64 | 104.91 % |
| ASUS X99 Deluxe |
|
446.00 | 104.76 % |
| ASRock X99 Extreme6 |
|
445.42 | 104.62 % |
| MSI X99S MPower |
|
444.95 | 104.51 % |
| ASUS X99-A |
|
444.88 | 104.50 % |
| Gigabyte X99-UD4 |
|
428.81 | 100.72 % |
| EVGA X99 Classified |
|
425.74 | 100.00 % |
| more is better | |||
Crytography
| SiSoft Sandra - Crytography - AES 256 |
Review Rating |
GB/sec | Percent |
| ASRock X99 OC Formula |
|
14.45 | 105.24 % |
| ASUS Rampage V Extreme |
|
14.45 | 105.24 % |
| ASRock X99 WS |
|
14.44 | 103.79 % |
| ASUS X99 Deluxe |
|
14.44 | 105.17 % |
| Gigabyte X99-SOC Force |
|
14.07 | 102.48 % |
| MSI X99S MPower |
|
14.03 | 102.18 % |
| ASRock X99 Extreme6 |
|
14.00 | 101.97 % |
| ASUS X99-A |
|
13.92 | 101.38 % |
| EVGA X99 Classified |
|
13.73 | 100.00 % |
| Gigabyte X99-UD4 |
|
13.50 | 98.18 % |
| more is better | |||
| SiSoft Sandra - Crytography - SHA 256 |
Review Rating |
GB/sec | Percent |
| ASRock X99 OC Formula |
|
9.28 | 100.54 % |
| ASUS X99 Deluxe |
|
9.26 | 100.32 % |
| ASUS Rampage V Extreme |
|
9.25 | 100.22 % |
| ASRock X99 WS |
|
9.25 | 100.22 % |
| Gigabyte X99-SOC Force |
|
9.24 | 100.11 % |
| EVGA X99 Classified |
|
9.23 | 100.00 % |
| ASRock X99 Extreme6 |
|
9.20 | 99.67 % |
| MSI X99S MPower |
|
9.19 | 99.57 % |
| Gigabyte X99-UD4 |
|
9.18 | 99.45 % |
| ASUS X99-A |
|
9.16 | 99.24 % |
| more is better | |||
SiSoft Sandra 2
Memory bandwidth
| SiSoft Sandra - Memory bandwidth - Integer |
Review Rating |
GB/sec | Percent |
| ASUS Rampage V Extreme |
|
46.61 | 104.74 % |
| ASUS X99 Deluxe |
|
46.59 | 104.70 % |
| ASRock X99 OC Formula |
|
46.57 | 104.65 % |
| ASUS X99-A |
|
46.55 | 104.61 % |
| ASRock X99 WS |
|
46.52 | 104.54 % |
| Gigabyte X99-SOC Force |
|
46.48 | 104.45 % |
| ASRock X99 Extreme6 |
|
45.87 | 103.08 % |
| MSI X99S MPower |
|
44.52 | 100.04 % |
| EVGA X99 Classified |
|
44.50 | 100.00 % |
| Gigabyte X99-UD4 |
|
43.23 | 97.15 % |
| more is better | |||
| SiSoft Sandra - Memory bandwidth - floating point |
Review Rating |
GB/sec | Percent |
| ASRock X99 OC Formula |
|
47.73 | 106.07 % |
| ASUS X99 Deluxe |
|
47.68 | 105.96 % |
| ASUS Rampage V Extreme |
|
47.20 | 104.89 % |
| ASRock X99 WS |
|
47.15 | 104.78 % |
| ASRock X99 Extreme6 |
|
46.61 | 103.58 % |
| ASUS X99-A |
|
45.92 | 102.04 % |
| Gigabyte X99-UD4 |
|
45.69 | 101.53 % |
| Gigabyte X99-SOC Force |
|
45.57 | 101.27 % |
| MSI X99S MPower |
|
45.55 | 101.22 % |
| EVGA X99 Classified |
|
45.00 | 100.00 % |
| more is better | |||
Memory latency
| SiSoft Sandra - Memory latency |
Review Rating |
ns | Percent |
| ASRock X99 WS |
|
27.4 | 100.00 % |
| EVGA X99 Classified |
|
27.4 | 100.00 % |
| ASRock X99 OC Formula |
|
27.6 | 99.28 % |
| Gigabyte X99-SOC Force |
|
27.6 | 99.28 % |
| ASUS X99 Deluxe |
|
27.7 | 98.92 % |
| ASRock X99 Extreme6 |
|
27.9 | 98.21 % |
| ASUS Rampage V Extreme |
|
27.8 | 98.56 % |
| MSI X99S MPower |
|
28.8 | 96.00 % |
| ASUS X99-A |
|
29.0 | 94.48 % |
| Gigabyte X99-UD4 |
|
30.0 | 91.33 % |
| less is better | more is better | ||
Memory and cache access
| SiSoft Sandra - Memory and cache access |
Review Rating |
GB/sec | Percent |
| ASRock X99 OC Formula |
|
351.69 | 104.81 % |
| ASUS Rampage V Extreme |
|
351.65 | 104.79 % |
| ASUS X99 Deluxe |
|
351.58 | 104.77 % |
| ASRock X99 WS |
|
348.54 | 103.87 % |
| Gigabyte X99-SOC Force |
|
347.68 | 103.61 % |
| MSI X99S MPower |
|
347.50 | 103.56 % |
| ASUS X99-A |
|
347.47 | 103.55 % |
| ASRock X99 Extreme6 |
|
339.12 | 101.06 % |
| Gigabyte X99-UD4 |
|
336.21 | 100.19 % |
| EVGA X99 Classified |
|
335.56 | 100.00 % |
| more is better | |||
UC Bench
| UC Bench |
Review Rating |
PW/sec | Percent |
| ASUS Rampage V Extreme |
|
1801.8 | 102.41 % |
| ASRock X99 OC Formula |
|
1801.5 | 102.39 % |
| Gigabyte X99-SOC Force |
|
1801.3 | 102.38 % |
| MSI X99S MPower |
|
1801.3 | 102.38 % |
| ASUS X99 Deluxe |
|
1801.2 | 102.38 % |
| ASRock X99 WS |
|
1799.7 | 102.29 % |
| ASRock X99 Extreme6 |
|
1799.5 | 102.28 % |
| ASUS X99-A |
|
1799.0 | 102.27 % |
| Gigabyte X99-UD4 |
|
1798.3 | 102.21 % |
| EVGA X99 Classified |
|
1759.4 | 100.00 % |
| more is better | |||
SuperPi 1M - 32M
SuperPi 1M
| SuperPi 1.5 XS - 1M |
Review Rating |
sec | Percent |
| ASRock X99 OC Formula |
|
10.233 | 103.04 % |
| ASUS Rampage V Extreme |
|
10.250 | 102.87 % |
| ASRock X99 WS |
|
10.389 | 101.49 % |
| ASUS X99-A |
|
10.390 | 101.48 % |
| Gigabyte X99-UD4 |
|
10.410 | 101.29 % |
| ASUS X99 Deluxe |
|
10.431 | 101.08 % |
| Gigabyte X99-SOC Force |
|
10.492 | 100.50 % |
| ASRock X99 Extreme6 |
|
10.502 | 100.40 % |
| MSI X99S MPower |
|
10.533 | 100.10 % |
| EVGA X99 Classified |
|
10.544 | 100.00 % |
| less is better | more is better | ||
SuperPi 32M
| SuperPi 1.5 XS - 32M |
Review Rating |
sec | Percent |
| ASRock X99 OC Formula |
|
541.659 | 100.67 % |
| ASUS Rampage V Extreme |
|
541.812 | 100.65 % |
| ASUS X99 Deluxe |
|
542.437 | 100.53 % |
| ASRock X99 WS |
|
542.553 | 100.51 % |
| Gigabyte X99-SOC Force |
|
542.588 | 100.50 % |
| ASRock X99 Extreme6 |
|
543.927 | 100.25 % |
| ASUS X99-A |
|
544.005 | 100.24 % |
| EVGA X99 Classified |
|
545.313 | 100.00 % |
| MSI X99S MPower |
|
552.218 | 98.75 % |
| Gigabyte X99-UD4 |
|
553.569 | 98.51 % |
| less is better | more is better | ||
wPrime 2.10 1024M Multicore
| wPrime - 1024M Multi Core |
Review Rating |
sec | Percent |
| Gigabyte X99-SOC Force |
|
103.896 | 102.56 % |
| ASUS Rampage V Extreme |
|
103.999 | 102.46 % |
| MSI X99S MPower |
|
104.022 | 102.43 % |
| ASRock X99 OC Formula |
|
104.049 | 102.41 % |
| ASUS X99 Deluxe |
|
104.047 | 102.41 % |
| ASUS X99-A |
|
104.488 | 101.98 % |
| Gigabyte X99-UD4 |
|
104.506 | 101.96 % |
| ASRock X99 Extreme6 |
|
104.755 | 101.72 % |
| ASRock X99 WS |
|
104.755 | 101.72 % |
| EVGA X99 Classified |
|
106.554 | 100.00 % |
| less is better | more is better | ||
Cinebench R15
Cinebench R15 - Multi Core
| Cinebench R15 - Multi Core |
Review Rating |
pts | Percent |
| ASUS X99 Deluxe |
|
1'402 | 105.33 % |
| ASRock X99 OC Formula |
|
1'398 | 105.03 % |
| ASRock X99 WS |
|
1'396 | 104.88 % |
| ASUS Rampage V Extreme |
|
1'396 | 104.88 % |
| ASUS X99-A |
|
1'396 | 104.88 % |
| Gigabyte X99-SOC Force |
|
1'395 | 104.81 % |
| MSI X99S MPower |
|
1'394 | 104.73 % |
| ASRock X99 Extreme6 |
|
1'391 | 104.51 % |
| Gigabyte X99-UD4 |
|
1'381 | 103.76 % |
| EVGA X99 Classified |
|
1'331 | 100.00 % |
| less is better | more is better | ||
Tomb Raider
Low resolution, low details
| Tomb Raider (low resolution, low details) |
Review Rating |
fps | Percent |
| ASUS Rampage V Extreme |
|
724.30 | 101.09 % |
| ASRock X99 OC Formula |
|
724.00 | 101.05 % |
| ASUS X99 Deluxe |
|
723.00 | 100.91 % |
| ASRock X99 WS |
|
722.60 | 100.85 % |
| ASRock X99 Extreme6 |
|
717.95 | 100.20 % |
| Gigabyte X99-SOC Force |
|
717.55 | 100.15 % |
| MSI X99S MPower |
|
717.00 | 100.07 % |
| EVGA X99 Classified |
|
716.50 | 100.00 % |
| ASUS X99-A |
|
700.22 | 97.73 % |
| Gigabyte X99-UD4 |
|
689.80 | 96.27 % |
| more is better | |||
High resolution, high details
| Tomb Raider (high resolution, high details) |
Review Rating |
fps | Percent |
| ASRock X99 WS |
|
52.3 | 100.38 % |
| ASUS Rampage V Extreme |
|
52.3 | 100.38 % |
| ASRock X99 OC Formula |
|
52.2 | 100.19 % |
| ASUS X99 Deluxe |
|
52.2 | 100.19 % |
| Gigabyte X99-SOC Force |
|
52.2 | 100.19 % |
| MSI X99S MPower |
|
52.2 | 100.19 % |
| EVGA X99 Classified |
|
52.1 | 100.00 % |
| ASRock X99 Extreme6 |
|
52.0 | 99.81 % |
| ASUS X99-A |
|
52.0 | 99.81 % |
| Gigabyte X99-UD4 |
|
52.0 | 99.81 % |
| more is better | |||
Metro Last Light
Low resolution, low details
| Metro Last Light (low details, low resolution) |
Review Rating |
fps | Percent |
| ASRock X99 WS |
|
202.81 | 101.28 % |
| ASRock X99 OC Formula |
|
202.61 | 101.16 % |
| ASUS X99 Deluxe |
|
202.12 | 100.93 % |
| ASUS Rampage V Extreme |
|
201.98 | 100.86 % |
| ASRock X99 Extreme6 |
|
200.99 | 100.37 % |
| Gigabyte X99-SOC Force |
|
200.67 | 100.21 % |
| EVGA X99 Classified |
|
200.25 | 100.00 % |
| ASUS X99-A |
|
200.12 | 99.94 % |
| MSI X99S MPower |
|
200.11 | 99.93 % |
| Gigabyte X99-UD4 |
|
199.98 | 99.87 % |
| more is better | |||
High resolution, high details
| Metro Last Light (high details, high resolution) |
Review Rating |
fps | Percent |
| ASUS X99 Deluxe |
|
64.93 | 100.51 % |
| ASRock X99 WS |
|
64.91 | 100.48 % |
| ASRock X99 OC Formula |
|
64.90 | 100.46 % |
| ASUS Rampage V Extreme |
|
64.88 | 100.43 % |
| Gigabyte X99-SOC Force |
|
64.86 | 100.40 % |
| ASRock X99 Extreme6 |
|
64.70 | 100.15 % |
| MSI X99S MPower |
|
64.60 | 100.00 % |
| EVGA X99 Classified |
|
64.60 | 100.00 % |
| ASUS X99-A |
|
64.58 | 99.97 % |
| Gigabyte X99-UD4 |
|
64.57 | 99.95 % |
| more is better | |||
Thief
Low resolution, low details
| Thief (low details, low resolution) |
Review Rating |
fps | Percent |
| ASUS Rampage V Extreme |
|
138.4 | 103.51 % |
| Gigabyte X99-SOC Force |
|
138.4 | 103.51 % |
| ASRock X99 Extreme6 |
|
138.3 | 103.44 % |
| ASUS X99 Deluxe |
|
138.3 | 103.44 % |
| ASRock X99 OC Formula |
|
138.0 | 103.22 % |
| MSI X99S MPower |
|
135.7 | 101.50 % |
| ASRock X99 WS |
|
135.1 | 101.08 % |
| ASUS X99-A |
|
134.7 | 100.75 % |
| Gigabyte X99-UD4 |
|
134.5 | 100.60 % |
| EVGA X99 Classified |
|
133.7 | 100.00 % |
| more is better | |||
High resolution, high details
| Thief (high details, high resolution) |
Review Rating |
fps | Percent |
| ASUS Rampage V Extreme |
|
84.4 | 102.55 % |
| ASRock X99 OC Formula |
|
84.2 | 102.31 % |
| Gigabyte X99-SOC Force |
|
83.2 | 101.09 % |
| ASUS X99 Deluxe |
|
83.1 | 100.97 % |
| ASRock X99 WS |
|
82.6 | 100.36 % |
| ASRock X99 Extreme6 |
|
82.4 | 100.12 % |
| Gigabyte X99-UD4 |
|
82.4 | 100.12 % |
| MSI X99S MPower |
|
82.4 | 100.12 % |
| ASUS X99-A |
|
82.3 | 100.00 % |
| EVGA X99 Classified |
|
82.3 | 100.00 % |
| more is better | |||
Right Mark Audio Analyzer
| Noise Level, dB (A) |
Review Rating |
|
| ASUS X99 Deluxe |
|
-94.6 |
| ASRock X99 Extrem 6 |
|
-87.4 |
| MSI X99S MPower |
|
-88.1 |
| ASRock X99 OC Formula |
|
-88.0 |
| Gigabyte X99-SOC Force |
|
-92.0 |
| EVGA X99 Classified |
|
-90.2 |
| ASRock X99 WS |
|
-88.9 |
| ASUS X99-A |
|
-88.7 |
| Gigabyte X99-UD4 |
|
-84.8 |
| ASUS Rampage V Extreme |
|
-84.6 |
| less is better | ||
| Dynamic Range dB (A) |
Review Rating |
|
| ASUS X99 Deluxe |
|
94.4 |
| Gigabyte X99-SOC Force |
|
92.0 |
| EVGA X99 Classified |
|
90.2 |
| ASRock X99 WS |
|
88.8 |
| ASUS X99-A |
|
88.7 |
| MSI X99S MPower |
|
88.1 |
| ASRock X99 OC Formula |
|
88.0 |
| ASRock X99 Extrem 6 |
|
87.2 |
| ASUS Rampage V Extreme |
|
84.7 |
| Gigabyte X99-UD4 |
|
84.5 |
| more is better | ||
| Total Harmonic Distortion (THD) |
Review Rating |
|
| ASRock X99 OC Formula |
|
0.0032 |
| ASUS Rampage V Extreme |
|
0.0048 |
| ASUS X99 Deluxe |
|
0.0062 |
| ASRock X99 Extrem 6 |
|
0.0083 |
| MSI X99S MPower |
|
0.0094 |
| Gigabyte X99-SOC Force |
|
0.0110 |
| Gigabyte X99-UD4 |
|
0.0112 |
| ASUS X99-A |
|
0.0114 |
| ASRock X99 WS |
|
0.0116 |
| EVGA X99 Classified |
|
0.0120 |
| less is better | ||
| Stereo Crosstalk |
Review Rating |
|
| ASUS X99 Deluxe |
|
-92.4 |
| Gigabyte X99-SOC Force |
|
-90.7 |
| ASRock X99 OC Formula |
|
-87.5 |
| ASUS X99-A |
|
-87.5 |
| MSI X99S MPower |
|
-87.5 |
| ASRock X99 WS |
|
-85.8 |
| ASRock X99 Extrem 6 |
|
-85.5 |
| EVGA X99 Classified |
|
-83.9 |
| Gigabyte X99 UD4 |
|
-83.7 |
| ASUS Rampage V Extreme |
|
-83.1 |
| less is better | ||
[pagebreak]
BCLK Overclocking
Idle
|
Review Rating |
MHz | Percent | |
| ASUS Rampage V Extreme |
|
179 | 105.29 % |
| ASUS X99 Deluxe |
|
178 | 104.71 % |
| ASRock X99 OC Formula |
|
176 | 103.53 % |
| ASRock X99 WS |
|
176 | 103.53 % |
| Gigabyte X99-SOC Force |
|
176 | 103.53 % |
| ASRock X99 Extreme6 |
|
175 | 102.94 % |
| ASUS X99-A |
|
175 | 102.94 % |
| Gigabyte X99-UD4 |
|
175 | 102.94 % |
| MSI X99S MPower |
|
174 | 102.35 % |
| EVGA X99 Classified |
|
170 | 100.00 % |
| less is better | more is better | ||
Power Consumption
Idle
| Idle |
Review Rating |
Watt | Percent |
| ASRock X99 WS |
|
81.15 | 127.11 % |
| Gigabyte X99-UD4 |
|
81.60 | 126.41 % |
| ASRock X99 Extreme6 |
|
84.50 | 120.91 % |
| ASRock X99 OC Formula |
|
85.42 | 120.76 % |
| ASUS X99-A |
|
88.50 | 116.55 % |
| ASUS X99 Deluxe |
|
91.40 | 112.86 % |
| Gigabyte X99-SOC Force |
|
102.17 | 100.96 % |
| EVGA X99 Classified |
|
103.15 | 100.00 % |
| ASUS Rampage V Extreme |
|
105.14 | 98.11 % |
| MSI X99S MPower |
|
108.55 | 95.03 % |
| less is better | more is better | ||
Load
| Load |
Review Rating |
Watt | Percent |
| ASUS X99-A |
|
176.20 | 108.20 % |
| ASUS X99 Deluxe |
|
178.20 | 106.99 % |
| ASRock X99 WS |
|
179.75 | 106.97 % |
| ASRock X99 OC Formula |
|
183.10 | 104.12 % |
| Gigabyte X99-UD4 |
|
186.77 | 102.08 % |
| ASRock X99 Extreme6 |
|
187.90 | 101.46 % |
| EVGA X99 Classified |
|
190.65 | 100.00 % |
| Gigabyte X99-SOC Force |
|
191.40 | 100.39 % |
| ASUS Rampage V Extreme |
|
202.67 | 94.07 % |
| MSI X99S MPower |
|
212.00 | 89.93 % |
| less is better | more is better | ||
Performance Rating
| 3D and Gaming Benchmarks |
Review Rating |
Percent |
| ASUS Rampage V Extreme |
|
102.38 % |
| ASRock X99 OC Formula |
|
102.28 % |
| ASUS X99 Deluxe |
|
101.85 % |
| ASRock X99 Extreme6 |
|
101.67 % |
| ASRock X99 WS |
|
101.41 % |
| Gigabyte X99-SOC Force |
|
101.39 % |
| ASUS X99-A |
|
101.28 % |
| MSI X99S MPower |
|
100.93 % |
| Gigabyte X99-UD4 |
|
100.32 % |
| EVGA X99 Classified |
|
100.00 % |
| more is better | ||
| 2D Benchmarks |
Review Rating |
Percent |
| ASRock X99 OC Formula |
|
103.10 % |
| ASUS Rampage V Extreme |
|
103.06 % |
| ASRock X99 WS |
|
102.99 % |
| ASUS X99 Deluxe |
|
102.98 % |
| Gigabyte X99-SOC Force |
|
102.52 % |
| ASRock X99 Extreme6 |
|
101.99 % |
| ASUS X99-A |
|
101.87 % |
| MSI X99S MPower |
|
101.54 % |
| Gigabyte X99-UD4 |
|
100.97 % |
| EVGA X99 Classified |
|
100.00 % |
| more is better | ||
| Performance per Watt |
Review Rating |
Percent |
| ASRock X99 WS |
|
86.64 % |
| Gigabyte X99-UD4 |
|
88.09 % |
| ASUS X99-A |
|
90.64 % |
| ASRock X99 OC Formula |
|
91.33 % |
| ASRock X99 Extreme6 |
|
91.59 % |
| ASUS X99 Deluxe |
|
93.18 % |
| EVGA X99 Classified |
|
100.00 % |
| Gigabyte X99-SOC Force |
|
101.27 % |
| ASUS Rampage V Extreme |
|
106.93 % |
| MSI X99S MPower |
|
109.46 % |
| less is better | ||
Price comparison
| Model |
Geizhals.eu |
| ASRock X99 Extreme6 |
|
| ASRock X99 OC Formula |
|
| ASRock X99 WS |
|
| ASUS Rampage V Extreme |
|
| ASUS X99 Deluxe |
|
| ASUS X99-A |
|
| EVGA X99 Classified |
|
| Gigabyte X99 SOC Force |
|
| Gigabyte X99-UD4 |
|
| MSI X99S MPower |
|
Conclusion
| Allgemein | + | - | |
| The X99 OC Formula from ASRock is
simply a great board. Already with the
predecessors we liked the individual design, which actually isn't that
easy to achieve anymore. Since ASUS, Gigabyte, MSI and co finally found
out that people, especially in the western part of this world, prefer
simple and decent color schemes, quite a lot of color combinations have
already been chosen. The OC Formula is a motherboard that really targets extreme overclockers, but nevertheless ASRock succeeded in crafting a product that is equally attractive to the guys playing with LN2 or watercooling/aircooling setups. Both worlds will be able to squeeze the maximum out of their systems using this board. Apart from overclockers also gamers will enjoy this board, since there is a beefed up audio solution. |
-
Design - 4 x PCI-Express 3.0 Slots - 10 x SATA3 (6Gbps) - 1 x M.2 x4 Gen3 - 1 x M.2 x2 Gen2 - Audio |
||
| Layout | + | - | |
|
The ASRock OC Formula's Layout has been very well thought. Once more practical are the angled SATA connectors as well as the power- and reset-buttons. ASRock even equipped this board with two M.2 slots, where one is wired through two Gen2 lanes and the other through four Gen3 lanes. There is also a debug display, which is always helpful if there are issues occuring with the motherboard itself or one of the installed components. Even the placement of the PCI-Express x16 is well chosen. There is a total of four of these slots and between two slots there is always an empty slot apart from the center. Here you find a full size Gen2 slot. We think this is a good number of PCI Express x16 slots for an overclocking/gaming motherboard altough most gamers will never use four graphics cards in their build. But still it leaves you with plenty of options if you want to plug in other expansion cards. Overclockers will also like the voltage readouts as well as conformal coating layer, which basically makes this board waterproof. In our opinion this board offers a very good feature mix. |
-
Angled SATA
connectors
- Power/Reset-Button onboard - SATA Express - M.2 x4 & M.2 x2 - Debug display - Space around the CPU socket - Voltage readouts - OC Buttons - Conformal Coating |
||
| Performance | + | - | |
| Calculating the average of all 3D benchmarks we ran, we see that this board ranks second in our comparison tables. When taking the average of all 2D results, this board even manages to make it to the very top of our chart. Other than that, when it comes to overclocking performance, there is not too much to say, since this board is simply perfect for any kind of overclocker. ASRock decided to remove some of the features like for example the status OLED, which makes the board a bit quicker at boot. On another note, we had a look at power consumption and noticed that this is one of the more efficient X99 motherboards we've had for testing so far when it comes to idle as well as load power consumption. In both scenarios this board stays in line with X99 boards which have less features. | -
3DMark Ice Storm Physics - 3DMark 11 - SiSoft Sandra 1 - SuperPi 1M/32M - Power consumption |
||
| Overclocking / BIOS | + | - | |
| As you might be expecting from ASRock meanwhile, you get a really good BIOS. It offers not only a lot of tuning and tweaking options but is also easy to use. Especially the pre-defined overclocking profiles are very helpful and experienced overclockers as well as less experienced user will appreciate the work that has gone into these profiles. | - Sheer amount of
options - Overclocking |
||
| Recommendation | + | - | |
| Should you be looking for a high-end overclocking motherboard, then the ASRock X99 OC Formula is a great choice with reasonable price of 305 Euros. | -
Enthusiast - Gaming - Extreme Overclocking |
||
| Rating | |||
| We give the ASRock X99 OC Formula very good 5 out of 5 stars. | |||

Author: m.buechel@ocaholic.ch