PowerColor LCS R9 290X Watercooled In-Game Performance
Category : Charts
Published by Hiwa Pouri on 27.02.14


The "Performance Index" value is calculated as the sum of all benchmarks results divided by the amount of games (3DMark and Unigine are not included into the calculation).
For the price we took the lowest price available on geizhals.eu.
 Article in English Article in English |
 Artikel in Deutsch Artikel in Deutsch |
 Article en
français Article en
français |
 Articolo in italiano Articolo in italiano |
Test Setup
| Motherboard |
|
| CPU |
|
| Memory |
|
| Graphics Cards |
|
| Drivers |
|
| Games and OS |
|
| System Drive |
|
| PSU |
|


3DMark - Fire Strike Performance
| Graphics Cards | Score | Graphics Score |
| PowerColor LCS R9 290X OC 1200MHz / 1500MHz | 10'302 | 12'308 |
| PowerColor LCS R9 290X | 9'400 | 10'988 |
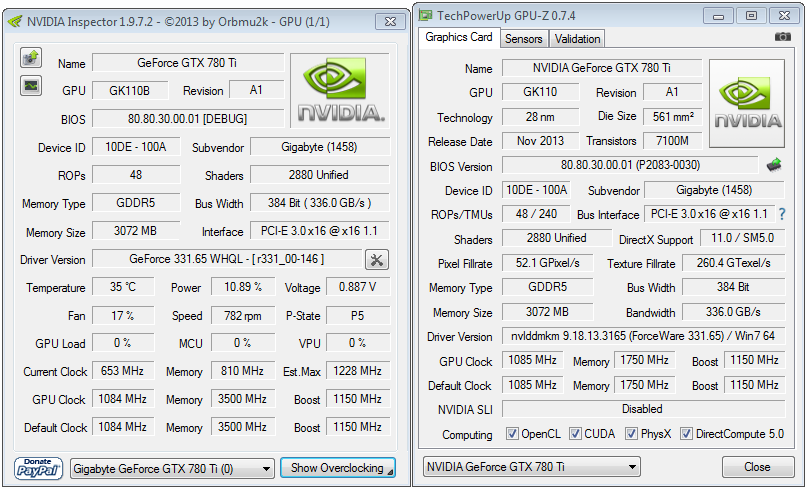
| nVidia GeForce GTX 780 Ti | 8'970 | 10'185 |
| MSI Twin Frozr Gaming GTX 780 OC Edition | 8'639 | 10'883 |
| nVidia GeForce GTX TITAN | 8'396 | 9'420 |
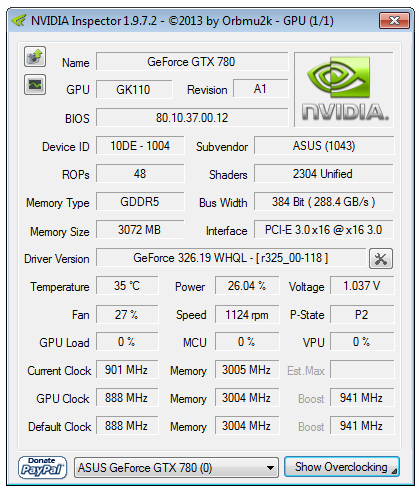
| nVidia GeForce GTX 780 | 7'877 | 8'734 |
| MSI Gaming R9 280X OC Edition | 7'294 | 8'146 |
| AMD Radeon HD 7970 GHz Edition | 7'091 | 7'922 |
| AMD Radeon R9 280X | 7'093 | 7'837 |
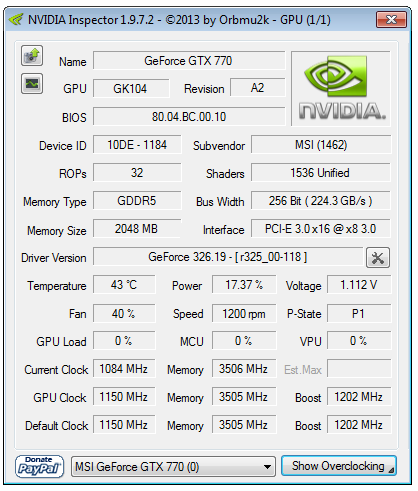
| nVidia GeForce GTX 770 | 6'679 | 7'408 |
| AMD Radeon HD 7970 | 6'578 | 7'215 |
| AMD Radeon HD 6990 | 6'350 | 7'207 |
| nVidia GeForce GTX 680 | 6'402 | 7'102 |
| MSI GTX 760 Gaming MINI-ITX | 5'801 | 6'338 |
| nVidia GeForce GTX 670 | 5'624 | 6'099 |
| AMD Radeon R9 270X | 5'318 | 5'784 |
| nVidia GeForce GTX 760 | 5'243 | 5'645 |
| AMD Radeon R9 270 | 5'059 | 5'483 |
| AMD Radeon HD 7870 | 5'009 | 5'436 |
| nVidia GeForce GTX 660 Ti | 4'885 | 5'270 |
| nVidia GeForce GTX 580 | 4'545 | 4'975 |
| nVidia GeForce GTX 660 | 4'415 | 4'707 |
| AMD Radeon HD 7850 | 4'176 | 4'460 |
| nVidia GeForce GTX 650 Ti Boost | 3'762 | 3'962 |
| AMD Radeon HD 6970 | 3'742 | 3'880 |
| AMD Radeon HD 7790 | 3'546 | 3'823 |
| AMD Radeon HD 6950 | 3'338 | 3'446 |
| AMD Radeon HD 5870 | 3'232 | 3'299 |
| nVidia GeForce GTX 650 Ti | 3'031 | 3'182 |
| AMD Radeon HD 6870 | 2'991 | 3'096 |
| AMD Radeon HD 5850 | 2'710 | 2'751 |
| More is better | ||
3DMark - Fire Strike Extreme
| Graphics Cards | Score | Graphics Score |
| PowerColor LCS R9 290X OC 1200MHz / 1500MHz | 5'303 | 5'660 |
| PowerColor LCS R9 290X | 4'823 | 5'101 |
| nVidia GeForce GTX 780 Ti | 4'550 | 4'747 |
| MSI Twin Frozr Gaming GTX 780 OC Edition | 4'406 | 4'562 |
| nVidia GeForce GTX TITAN | 4'271 | 4'420 |
| nVidia GeForce GTX 780 | 4'007 | 4'121 |
| MSI Gaming R9 280X OC Edition | 3'634 | 3'757 |
| AMD Radeon HD 7970 GHz Edition | 3'568 | 3'720 |
| AMD Radeon R9 280X | 3'564 | 3'668 |
| nVidia GeForce GTX 770 | 3'319 | 3'448 |
| AMD Radeon HD 6990 | 3'185 | 3'274 |
| AMD Radeon HD 7970 | 3'291 | 3'383 |
| nVidia GeForce GTX 680 | 3'176 | 3'286 |
| MSI GTX 760 Gaming MINI-ITX | 2'904 | 2'970 |
| nVidia GeForce GTX 670 | 2'805 | 2'872 |
| AMD Radeon R9 270X | 2'657 | 2'739 |
| nVidia GeForce GTX 760 | 2'610 | 2'655 |
| AMD Radeon R9 270 | 2'503 | 2'562 |
| AMD Radeon HD 7870 | 2'484 | 2'560 |
| nVidia GeForce GTX 660 Ti | 2'378 | 2'440 |
| nVidia GeForce GTX 580 | 2'213 | 2'350 |
| nVidia GeForce GTX 660 | 2'178 | 2'202 |
| AMD Radeon HD 7850 | 2'044 | 2'073 |
| nVidia GeForce GTX 650 Ti Boost | 1'842 | 1'848 |
| AMD Radeon HD 6970 | 1'784 | 1'760 |
| AMD Radeon HD 6950 | 1'585 | 1'555 |
| AMD Radeon HD 7790 | 1'456 | 1'437 |
| AMD Radeon HD 6870 | 1'101 | 1'025 |
| AMD Radeon HD 5870 | 1'005 | 1'005 |
| nVidia GeForce GTX 650 Ti | 942 | 983 |
| AMD Radeon HD 5850 | 959 | 878 |
| More is better | ||
Unigine Heaven 4.0 Extreme Preset
| Graphics Cards | Score | fps |
| PowerColor LCS R9 290X OC 1200MHz / 1500MHz | 1'901 | 75.5 |
| PowerColor LCS R9 290X | 1'754 | 68.9 |
| nVidia GeForce GTX 780 Ti | 1'744 | 69.2 |
| MSI Twin Frozr Gaming GTX 780 OC Edition | 1'603 | 63.6 |
| nVidia GeForce GTX TITAN | 1'594 | 63.3 |
| nVidia GeForce GTX 780 | 1'537 | 61.0 |
| nVidia GeForce GTX 680 | 1'261 | 50.0 |
| nVidia GeForce GTX 770 | 1'204 | 47.8 |
| AMD Radeon HD 6990 | 1'156 | 45.9 |
| AMD Radeon HD 7970 GHz Edition | 1'137 | 45.1 |
| MSI Gaming R9 280X OC Edition | 1'135 | 45.0 |
| AMD Radeon R9 280X | 1'113 | 44.2 |
| AMD Radeon HD 7970 | 1'034 | 41.1 |
| nVidia GeForce GTX 670 | 1'028 | 40.8 |
| MSI GTX 760 Gaming MINI-ITX | 1'004 | 39.9 |
| nVidia GeForce GTX 760 | 951 | 37.8 |
| nVidia GeForce GTX 580 | 915 | 36.3 |
| AMD Radeon R9 270X | 886 | 35.2 |
| nVidia GeForce GTX 660 Ti | 866 | 34.4 |
| AMD Radeon R9 270 | 832 | 33.0 |
| AMD Radeon HD 7870 | 826 | 32.8 |
| nVidia GeForce GTX 660 | 801 | 31.8 |
| nVidia GeForce GTX 650 Ti Boost | 705 | 28.0 |
| AMD Radeon HD 7850 | 684 | 27.2 |
| AMD Radeon HD 6970 | 620 | 24.6 |
| AMD Radeon HD 7790 | 568 | 22.5 |
| AMD Radeon HD 6950 | 556 | 22.1 |
| AMD Radeon HD 6870 | 510 | 20.3 |
| nVidia GeForce GTX 650 Ti | 498 | 19.8 |
| AMD Radeon HD 5870 | 478 | 19.0 |
| AMD Radeon HD 5850 | 403 | 16.0 |
| More is better | ||
BattleField 3
| High Preset, 1920x1080, 4xMSAA, Ultra, SSAO | Average FPS |
| PowerColor LCS R9 290X OC 1200MHz / 1500MHz | 110.19 |
| nVidia GeForce GTX 780 Ti | 101.0 |
| PowerColor LCS R9 290X | 98.98 |
| nVidia GeForce GTX TITAN | 96.4 |
| MSI Twin Frozr Gaming GTX 780 OC Edition | 94.0 |
| nVidia GeForce GTX 780 | 90.4 |
| AMD Radeon HD 7970 GHz Edition | 78.4 |
| MSI Gaming R9 280X OC Edition | 77.0 |
| AMD Radeon R9 280X | 76.6 |
| nVidia GeForce GTX 770 | 76.6 |
| nVidia GeForce GTX 680 | 72.8 |
| AMD Radeon HD 7970 | 71.2 |
| MSI GTX 760 Gaming MINI-ITX | 67.0 |
| nVidia GeForce GTX 670 | 66.0 |
| AMD Radeon HD 6990 | 65.6 |
| nVidia GeForce GTX 760 | 62.0 |
| AMD Radeon R9 270X | 58.2 |
| nVidia GeForce GTX 660 Ti | 55.8 |
| AMD Radeon R9 270 | 55.0 |
| AMD Radeon HD 7870 | 54.2 |
| nVidia GeForce GTX 660 | 50.6 |
| nVidia GeForce GTX 580 | 48.6 |
| AMD Radeon HD 7850 | 44.6 |
| nVidia GeForce GTX 650 Ti Boost | 44.2 |
| AMD Radeon HD 7790 | 36.6 |
| AMD Radeon HD 6970 | 35.8 |
| nVidia GeForce GTX 650 Ti | 33.2 |
| AMD Radeon HD 5870 | 32.6 |
| AMD Radeon HD 6950 | 32.0 |
| AMD Radeon HD 6870 | 29.8 |
| AMD Radeon HD 5850 | 26.6 |
| More is better |
Bioshock Infinite - Benchmark
| Ultra Preset, 1920x1080, AA, no DDOF | Average FPS |
| PowerColor LCS R9 290X OC 1200MHz / 1500MHz | 108.82 |
| MSI Twin Frozr Gaming GTX 780 OC Edition | 103.53 |
| nVidia GeForce GTX 780 Ti | 103.24 |
| PowerColor LCS R9 290X | 100.03 |
| nVidia GeForce GTX TITAN | 95.55 |
| nVidia GeForce GTX 780 | 90.78 |
| nVidia GeForce GTX 770 | 78.98 |
| AMD Radeon HD 6990 | 78.01 |
| AMD Radeon HD 7970 GHz Edition | 76.80 |
| nVidia GeForce GTX 680 | 75.68 |
| AMD Radeon R9 280X | 75.44 |
| MSI Gaming R9 280X OC Edition | 73.48 |
| MSI GTX 760 Gaming MINI-ITX | 71.54 |
| AMD Radeon HD 7970 | 70.13 |
| nVidia GeForce GTX 670 | 67.87 |
| nVidia GeForce GTX 760 | 62.41 |
| nVidia GeForce GTX 660 Ti | 60.36 |
| AMD Radeon R9 270X | 54.79 |
| nVidia GeForce GTX 660 | 52.91 |
| AMD Radeon R9 270 | 51.11 |
| nVidia GeForce GTX 580 | 51.04 |
| AMD Radeon HD 7870 | 50.55 |
| nVidia GeForce GTX 650 Ti Boost | 45.77 |
| AMD Radeon HD 6970 | 43.20 |
| AMD Radeon HD 7850 | 43.13 |
| AMD Radeon HD 5870 | 39.28 |
| AMD Radeon HD 6950 | 38.13 |
| nVidia GeForce GTX 650 Ti | 34.89 |
| AMD Radeon HD 7790 | 34.65 |
| AMD Radeon HD 6870 | 33.69 |
| AMD Radeon HD 5850 | 32.42 |
| More is better |
Crysis 3
| High Preset, 1920x1080, 8xMSAA, Very High | Average FPS |
| nVidia GeForce GTX 780 Ti | 33.8 |
| MSI Twin Frozr Gaming GTX 780 OC Edition | 33.2 |
| nVidia GeForce GTX TITAN | 31.8 |
| nVidia GeForce GTX 780 | 30.2 |
| PowerColor LCS R9 290X OC 1200MHz / 1500MHz | 30.3 |
| PowerColor LCS R9 290X | 27.2 |
| AMD Radeon HD 6990 | 26.8 |
| nVidia GeForce GTX 770 | 25.8 |
| nVidia GeForce GTX 680 | 24.4 |
| MSI GTX 760 Gaming MINI-ITX | 23.0 |
| nVidia GeForce GTX 670 | 22.2 |
| MSI Gaming R9 280X OC Edition | 20.8 |
| nVidia GeForce GTX 760 | 20.4 |
| AMD Radeon HD 7970 GHz Edition | 19.8 |
| AMD Radeon R9 280X | 19.4 |
| nVidia GeForce GTX 660 Ti | 18.8 |
| AMD Radeon HD 7970 | 18.4 |
| nVidia GeForce GTX 580 | 17.0 |
| nVidia GeForce GTX 660 | 16.8 |
| nVidia GeForce GTX 650 Ti Boost | 15.0 |
| AMD Radeon R9 270X | 15.0 |
| AMD Radeon HD 6970 | 14.6 |
| AMD Radeon HD 7870 | 14.2 |
| AMD Radeon R9 270 | 14.0 |
| AMD Radeon HD 6950 | 12.2 |
| AMD Radeon HD 7850 | 11.8 |
| nVidia GeForce GTX 650 Ti | 10.2 |
| AMD Radeon HD 6870 | 8.4 |
| AMD Radeon HD 7790 | 8.0 |
| AMD Radeon HD 5870 | 8.0 |
| AMD Radeon HD 5850 | 7.6 |
| More is better |
Call of Duty Black Ops 2
| High Preset, 1920x1080, 8xMSAA, High | Average FPS |
| PowerColor LCS R9 290X OC 1200MHz / 1500MHz | 152.67 |
| PowerColor LCS R9 290X | 145.97 |
| nVidia GeForce GTX 780 Ti | 137.2 |
| MSI Twin Frozr Gaming GTX 780 OC Edition | 134.0 |
| nVidia GeForce GTX TITAN | 130.2 |
| AMD Radeon HD 6990 | 127.0 |
| nVidia GeForce GTX 780 | 121.0 |
| nVidia GeForce GTX 770 | 109.0 |
| nVidia GeForce GTX 680 | 105.4 |
| AMD Radeon HD 7970 GHz Edition | 103.6 |
| MSI Gaming R9 280X OC Edition | 103.0 |
| AMD Radeon R9 280X | 102.8 |
| MSI GTX 760 Gaming MINI-ITX | 99.0 |
| nVidia GeForce GTX 670 | 95.8 |
| AMD Radeon HD 7970 | 93.2 |
| nVidia GeForce GTX 760 | 86.0 |
| AMD Radeon R9 270X | 84.4 |
| nVidia GeForce GTX 580 | 81.8 |
| nVidia GeForce GTX 660 Ti | 81.4 |
| AMD Radeon HD 7870 | 79.2 |
| AMD Radeon R9 270 | 79.0 |
| nVidia GeForce GTX 660 | 72.0 |
| AMD Radeon HD 7850 | 69.0 |
| AMD Radeon HD 6970 | 68.6 |
| AMD Radeon HD 5870 | 64.6 |
| AMD Radeon HD 6950 | 62.4 |
| nVidia GeForce GTX 650 Ti Boost | 62.4 |
| AMD Radeon HD 6870 | 58.4 |
| AMD Radeon HD 5850 | 54.4 |
| nVidia GeForce GTX 650 Ti | 48.2 |
| AMD Radeon HD 7790 | 46.4 |
| More is better |
DIRT Showdown - Benchmark
| High Preset, 1920x1080, 8xMSAA, Ultra | Average FPS |
| PowerColor LCS R9 290X OC 1200MHz / 1500MHz | 118.56 |
| PowerColor LCS R9 290X | 107.93 |
| nVidia GeForce GTX 780 Ti | 98.04 |
| MSI Twin Frozr Gaming GTX 780 OC Edition | 89.13 |
| nVidia GeForce GTX TITAN | 87.97 |
| nVidia GeForce GTX 780 | 82.36 |
| MSI Gaming R9 280X OC Edition | 81.65 |
| AMD Radeon HD 6990 | 80.30 |
| AMD Radeon HD 7970 GHz Edition | 79.22 |
| AMD Radeon R9 280X | 76.46 |
| AMD Radeon HD 7970 | 71.63 |
| nVidia GeForce GTX 770 | 68.79 |
| nVidia GeForce GTX 680 | 67.04 |
| AMD Radeon R9 270X | 64.63 |
| AMD Radeon R9 270 | 62.99 |
| AMD Radeon HD 7870 | 62.53 |
| nVidia GeForce GTX 670 | 58.98 |
| MSI GTX 760 Gaming MINI-ITX | 58.50 |
| nVidia GeForce GTX 660 Ti | 54.27 |
| nVidia GeForce GTX 760 | 52.48 |
| AMD Radeon HD 7850 | 50.61 |
| nVidia GeForce GTX 580 | 48.92 |
| nVidia GeForce GTX 660 | 45.35 |
| AMD Radeon HD 6970 | 44.19 |
| AMD Radeon HD 7790 | 43.28 |
| AMD Radeon HD 6950 | 38.94 |
| nVidia GeForce GTX 650 Ti Boost | 38.02 |
| AMD Radeon HD 5870 | 36.48 |
| nVidia GeForce GTX 650 Ti | 30.35 |
| AMD Radeon HD 6870 | 30.05 |
| AMD Radeon HD 5850 | 29.13 |
| More is better |
Far Cry 3
| High Preset, 1920x1080, 8xMSAA, Ultra | Average FPS |
| PowerColor LCS R9 290X OC 1200MHz / 1500MHz | 58.4 |
| PowerColor LCS R9 290X | 53.3 |
| nVidia GeForce GTX 780 Ti | 53.2 |
| nVidia GeForce GTX TITAN | 50.2 |
| MSI Twin Frozr Gaming GTX 780 OC Edition | 49.2 |
| nVidia GeForce GTX 780 | 47.2 |
| AMD Radeon HD 6990 | 39.8 |
| nVidia GeForce GTX 770 | 38.2 |
| nVidia GeForce GTX 680 | 35.6 |
| MSI Gaming R9 280X OC Edition | 34.8 |
| nVidia GeForce GTX 670 | 32.2 |
| AMD Radeon HD 7970 GHz Edition | 31.0 |
| MSI GTX 760 Gaming MINI-ITX | 30.9 |
| AMD Radeon R9 280X | 30.0 |
| nVidia GeForce GTX 760 | 29.4 |
| AMD Radeon HD 7970 | 27.8 |
| nVidia GeForce GTX 660 Ti | 27.0 |
| nVidia GeForce GTX 580 | 24.8 |
| nVidia GeForce GTX 660 | 24.6 |
| AMD Radeon R9 270X | 23.8 |
| AMD Radeon HD 7870 | 22.4 |
| AMD Radeon R9 270 | 22.0 |
| nVidia GeForce GTX 650 Ti Boost | 21.2 |
| AMD Radeon HD 6970 | 20.6 |
| AMD Radeon HD 6950 | 18.0 |
| AMD Radeon HD 7850 | 17.8 |
| nVidia GeForce GTX 650 Ti | 15.4 |
| AMD Radeon HD 5870 | 15.2 |
| AMD Radeon HD 6870 | 13.0 |
| AMD Radeon HD 5850 | 13.0 |
| AMD Radeon HD 7790 | 10.6 |
| More is better |
Sleeping Dogs - Benchmark
| High Preset, 1920x1080, Extreme, High-Res Textures | Average FPS |
| PowerColor LCS R9 290X OC 1200MHz / 1500MHz | 75.9 |
| PowerColor LCS R9 290X | 69.9 |
| nVidia GeForce GTX 780 Ti | 69.8 |
| MSI Twin Frozr Gaming GTX 780 OC Edition | 63.8 |
| nVidia GeForce GTX TITAN | 62.4 |
| nVidia GeForce GTX 780 | 58.7 |
| AMD Radeon HD 6990 | 56.6 |
| MSI Gaming R9 280X OC Edition | 52.1 |
| AMD Radeon HD 7970 GHz Edition | 51.7 |
| nVidia GeForce GTX 770 | 51.7 |
| AMD Radeon R9 280X | 50.7 |
| nVidia GeForce GTX 680 | 48.7 |
| AMD Radeon HD 7970 | 47.0 |
| nVidia GeForce GTX 670 | 42.7 |
| MSI GTX 760 Gaming MINI-ITX | 42.2 |
| nVidia GeForce GTX 760 | 38.7 |
| nVidia GeForce GTX 660 Ti | 38.7 |
| AMD Radeon R9 270X | 36.4 |
| nVidia GeForce GTX 580 | 35.1 |
| AMD Radeon R9 270 | 34.2 |
| AMD Radeon HD 7870 | 33.8 |
| nVidia GeForce GTX 660 | 32.0 |
| AMD Radeon HD 6970 | 30.0 |
| AMD Radeon HD 7850 | 27.6 |
| AMD Radeon HD 5870 | 27.3 |
| nVidia GeForce GTX 650 Ti Boost | 26.3 |
| AMD Radeon HD 6950 | 26.2 |
| AMD Radeon HD 6870 | 22.9 |
| AMD Radeon HD 7790 | 22.2 |
| AMD Radeon HD 5850 | 22.2 |
| nVidia GeForce GTX 650 Ti | 19.9 |
| More is better |
The Elder Scrolls V: Skyrim
| High Preset, 1920x1080, 8xAA, Ultra | Average FPS |
| nVidia GeForce GTX 780 Ti | 135.0 |
| PowerColor LCS R9 290X OC 1200MHz / 1500MHz | 134.2 |
| PowerColor LCS R9 290X | 133.2 |
| MSI Twin Frozr Gaming GTX 780 OC Edition | 132.0 |
| nVidia GeForce GTX TITAN | 127.2 |
| nVidia GeForce GTX 780 | 126.2 |
| AMD Radeon HD 7970 GHz Edition | 110.4 |
| AMD Radeon HD 6990 | 109.2 |
| nVidia GeForce GTX 770 | 109.0 |
| MSI Gaming R9 280X OC Edition | 107.0 |
| nVidia GeForce GTX 680 | 106.4 |
| AMD Radeon R9 280X | 106.0 |
| AMD Radeon HD 7970 | 98.6 |
| MSI GTX 760 Gaming MINI-ITX | 96.7 |
| nVidia GeForce GTX 670 | 96.4 |
| AMD Radeon R9 270X | 90.4 |
| nVidia GeForce GTX 760 | 87.6 |
| AMD Radeon HD 7870 | 85.2 |
| nVidia GeForce GTX 580 | 84.8 |
| AMD Radeon R9 270 | 82.8 |
| nVidia GeForce GTX 660 Ti | 81.4 |
| nVidia GeForce GTX 660 | 73.0 |
| AMD Radeon HD 7850 | 71.0 |
| AMD Radeon HD 6970 | 64.0 |
| nVidia GeForce GTX 650 Ti Boost | 63.2 |
| AMD Radeon HD 6950 | 58.4 |
| AMD Radeon HD 5870 | 56.6 |
| AMD Radeon HD 7790 | 56.2 |
| AMD Radeon HD 6870 | 52.0 |
| AMD Radeon HD 5850 | 48.6 |
| nVidia GeForce GTX 650 Ti | 47.2 |
| More is better |
Metro: Last Light - Benchmark
| Very High, 1920x1080, SSAA, DX11 | Average FPS |
| PowerColor LCS R9 290X OC 1200MHz / 1500MHz | 52.72 |
| PowerColor LCS R9 290X | 46.58 |
| nVidia GeForce GTX 780 Ti | 45.19 |
| MSI Twin Frozr Gaming GTX 780 OC Edition | 42.94 |
| nVidia GeForce GTX TITAN | 39.94 |
| nVidia GeForce GTX 780 | 38.18 |
| MSI Gaming R9 280X OC Edition | 33.97 |
| AMD Radeon R9 280X | 33.78 |
| AMD Radeon HD 7970 GHz Edition | 33.41 |
| nVidia GeForce GTX 770 | 32.53 |
| AMD Radeon HD 7970 | 30.98 |
| nVidia GeForce GTX 680 | 30.56 |
| AMD Radeon HD 6990 | 27.65 |
| nVidia GeForce GTX 670 | 27.30 |
| MSI GTX 760 Gaming MINI-ITX | 27.28 |
| nVidia GeForce GTX 760 | 25.09 |
| nVidia GeForce GTX 660 Ti | 23.97 |
| AMD Radeon R9 270X | 23.46 |
| nVidia GeForce GTX 580 | 23.25 |
| AMD Radeon R9 270 | 21.93 |
| AMD Radeon HD 7870 | 21.58 |
| nVidia GeForce GTX 660 | 20.84 |
| AMD Radeon HD 7850 | 18.09 |
| nVidia GeForce GTX 650 Ti Boost | 17.83 |
| AMD Radeon HD 6970 | 17.05 |
| AMD Radeon HD 6950 | 15.22 |
| AMD Radeon HD 7790 | 14.94 |
| nVidia GeForce GTX 650 Ti | 13.83 |
| AMD Radeon HD 5870 | 13.33 |
| AMD Radeon HD 6870 | 12.37 |
| AMD Radeon HD 5850 | 11.11 |
| More is better |
Grand Theft Auto V
Power Consumption
| Power Consumption Idle* | Watts |
| PowerColor LCS R9 290X OC 1200MHz / 1500MHz | 102 |
| PowerColor LCS R9 290X | 92 |
| AMD Radeon HD 6990 (Ref) | 80 |
| nVidia GeForce GTX 580 (Ref) | 69 |
| MSI Gaming R9 280X OC Edition | 65 |
| AMD Radeon HD 7970 GHz Edition (ASUS Matrix P.) | 60 |
| MSI Twin Frozr Gaming GTX 780 OC Edition | 59 |
| AMD Radeon HD 6970 (Ref) | 57 |
| AMD Radeon HD 6950 (Ref) | 57 |
| MSI GTX 760 Gaming MINI-ITX | 57 |
| AMD Radeon HD 5850 (Ref) | 56 |
| AMD Radeon HD 6870 (Ref) | 54 |
| nVidia GeForce GTX 780 (ASUS DC2OC) | 54 |
| nVidia GeForce GTX 660 Ti (ASUS DC2T) | 54 |
| AMD Radeon HD 5870 (Ref) | 53 |
| AMD Radeon R9 270 (ASUS DC2OC) | 53 |
| nVidia GeForce GTX 770 (ASUS DC2OC) | 53 |
| nVidia GeForce GTX 670 (ASUS DC2T) | 52 |
| nVidia GeForce GTX 680 (Ref) | 51 |
| nVidia GeForce GTX 660 (ASUS DC2T) | 50 |
| nVidia GeForce GTX 780 Ti (GBT GHz) | 48 |
| AMD Radeon HD 7870 (ASUS DC2T V2) | 48 |
| AMD Radeon R9 280X (ASUS DC2T) | 48 |
| AMD Radeon R9 270X (ASUS DC2T) | 48 |
| AMD Radeon HD 7970 (XFX DD - Ref PCB) | 47 |
| nVidia GeForce GTX TITAN (Ref) | 47 |
| nVidia GeForce GTX 650 Ti (ASUS DC2T) | 45 |
| AMD Radeon HD 7850 (ASUS DC2T) | 45 |
| AMD Radeon HD 7790 (ASUS DC2OC - Ref PCB) | 45 |
| nVidia GeForce GTX 760 (ASUS DC2OC) | 45 |
| nVidia GeForce GTX 650 Ti Boost (Ref) | 43 |
| *Entire system | Less is better |
| Power Consumption Load (FurMark)* | Watts |
| PowerColor LCS R9 290X OC 1200MHz / 1500MHz | 530 |
| AMD Radeon HD 6990 (Ref) | 481 |
| PowerColor LCS R9 290X | 425 |
| AMD Radeon HD 7970 GHz Edition (ASUS Matrix P.) | 360 |
| MSI Gaming R9 280X OC Edition | 358 |
| nVidia GeForce GTX 780 Ti (GBT GHz) | 333 |
| AMD Radeon HD 7970 (XFX DD - Ref PCB) | 323 |
| MSI Twin Frozr Gaming GTX 780 OC Edition | 321 |
| AMD Radeon R9 280X (ASUS DC2T) | 320 |
| nVidia GeForce GTX TITAN (Ref) | 306 |
| nVidia GeForce GTX 780 (ASUS DC2OC) | 302 |
| nVidia GeForce GTX 680 (Ref) | 258 |
| nVidia GeForce GTX 770 (ASUS DC2OC) | 257 |
| nVidia GeForce GTX 580 (Ref) | 254 |
| AMD Radeon HD 6970 (Ref) | 244 |
| MSI GTX 760 Gaming MINI-ITX | 241 |
| AMD Radeon HD 5870 (Ref) | 232 |
| nVidia GeForce GTX 670 (ASUS DC2T) | 227 |
| AMD Radeon R9 270X (ASUS DC2T) | 223 |
| AMD Radeon HD 7870 (ASUS DC2T V2) | 220 |
| nVidia GeForce GTX 760 (ASUS DC2OC) | 218 |
| AMD Radeon HD 6950 (Ref) | 208 |
| AMD Radeon HD 6870 (Ref) | 200 |
| AMD Radeon HD 7850 (ASUS DC2T) | 195 |
| AMD Radeon R9 270 (ASUS DC2OC) | 194 |
| AMD Radeon HD 5850 (Ref) | 193 |
| nVidia GeForce GTX 660 Ti (ASUS DC2T) | 178 |
| nVidia GeForce GTX 660 (ASUS DC2T) | 177 |
| nVidia GeForce GTX 650 Ti Boost (Ref) | 169 |
| AMD Radeon HD 7790 (ASUS DC2OC - Ref PCB) | 152 |
| nVidia GeForce GTX 650 Ti (ASUS DC2T) | 151 |
| *Entire system | Less is better |
Performance/Watt
| Graphics Cards | Performance Index | Power C. (Watts)* | Performance/Watt*10 |
| nVidia GeForce GTX 660 Ti (ASUS DC2T) | 53.55 | 178 | 3.01 |
| nVidia GeForce GTX TITAN (Ref) | 85.05 | 306 | 2.78 |
| nVidia GeForce GTX 770 (ASUS DC2OC) | 70.92 | 257 | 2.76 |
| nVidia GeForce GTX 670 (ASUS DC2T) | 62.00 | 227 | 2.73 |
| nVidia GeForce GTX 780 Ti (GBT GHz) | 90.53 | 333 | 2.72 |
| nVidia GeForce GTX 780 (ASUS DC2OC) | 81.66 | 302 | 2.70 |
| nVidia GeForce GTX 660 (ASUS DC2T) | 47.37 | 177 | 2.68 |
| nVidia GeForce GTX 680 (Ref) | 68.36 | 258 | 2.65 |
| nVidia GeForce GTX 760 (ASUS DC2OC) | 56.63 | 218 | 2.60 |
| AMD Radeon R9 270 (ASUS DC2OC) | 49.98 | 194 | 2.58 |
| MSI Twin Frozr Gaming GTX 780 OC Edition | 82.42 | 321 | 2.56 |
| nVidia GeForce GTX 650 Ti Boost (Ref) | 40.87 | 169 | 2.42 |
| AMD Radeon R9 270X (ASUS DC2T) | 53.39 | 223 | 2.39 |
| MSI GTX 760 Gaming MINI-ITX | 57.35 | 241 | 2.38 |
| PowerColor LCS R9 290X | 97.83 | 425 | 2.30 |
| AMD Radeon HD 7870 (ASUS DC2T V2) | 50.03 | 220 | 2.27 |
| AMD Radeon HD 7850 (ASUS DC2T) | 42.04 | 195 | 2.16 |
| AMD Radeon HD 7790 (ASUS DC2OC - Ref PCB) | 32.75 | 152 | 2.15 |
| AMD Radeon R9 280X (ASUS DC2T) | 68.40 | 320 | 2.14 |
| nVidia GeForce GTX 650 Ti (ASUS DC2T) | 30.8 | 151 | 2.04 |
| nVidia GeForce GTX 580 (Ref) | 50.49 | 254 | 1.99 |
| PowerColor LCS R9 290X OC 1200MHz / 1500MHz | 104.89 | 530 | 1.97 |
| AMD Radeon HD 7970 (XFX DD - Ref PCB) | 63.41 | 323 | 1.96 |
| AMD Radeon HD 7970 GHz Edition (ASUS Matrix P.) | 69.99 | 360 | 1.94 |
| MSI Gaming R9 280X OC Edition | 64.87 | 351 | 1.81 |
| AMD Radeon HD 6950 (Ref) | 36.83 | 208 | 1.77 |
| AMD Radeon HD 6970 (Ref) | 41.32 | 244 | 1.69 |
| AMD Radeon HD 6870 (Ref) | 31.88 | 200 | 1.59 |
| AMD Radeon HD 5850 (Ref) | 30.05 | 193 | 1.56 |
| AMD Radeon HD 5870 (Ref) | 35.98 | 232 | 1.55 |
| AMD Radeon HD 6990 (Ref) | 73.96 | 481 | 1.54 |
| *Entire system | More is better | Less is better | More is better |
The "Performance Index" value is calculated as the sum of all benchmarks results divided by the amount of games (3DMark and Unigine are not included into the calculation).
Performance/Price
| Graphics Cards | Performance Index | Price (€) | Performance/€*10 |
| nVidia GeForce GTX 650 Ti Boost | 40.87 | 108 | 3.78 |
| AMD Radeon HD 7870 | 50.03 | 135 | 3.71 |
| AMD Radeon R9 270 | 49.98 | 147 | 3.40 |
| AMD Radeon HD 7850 | 40.04 | 119 | 3.36 |
| AMD Radeon HD 7790 | 32.75 | 98 | 3.34 |
| nVidia GeForce GTX 660 | 47.37 | 143 | 3.31 |
| AMD Radeon R9 270X | 53.39 | 162 | 3.30 |
| nVidia GeForce GTX 650 Ti | 30.80 | 100 | 3.08 |
| nVidia GeForce GTX 670 | 62.00 | 214 | 2.90 |
| nVidia GeForce GTX 660 Ti | 53.55 | 190 | 2.82 |
| AMD Radeon HD 7970 | 63.41 | 220 | 2.88 |
| nVidia GeForce GTX 760 | 56.63 | 198 | 2.86 |
| AMD Radeon R9 280X | 68.40 | 240 | 2.85 |
| nVidia GeForce GTX 770 | 70.92 | 265 | 2.68 |
| AMD Radeon HD 6870 | 31.88 | 125 | 2.55 |
| AMD Radeon HD 7970 GHz Edition | 69.99 | 275 | 2.55 |
| MSI Gaming R9 280X OC Edition | 64.87 | 263 | 2.47 |
| MSI GTX 760 Gaming MINI-ITX | 57.35 | 241 | 2.40 |
| nVidia GeForce GTX 680 | 68.36 | 300 | 2.28 |
| PowerColor LCS R9 290X | 97.83 | 483 | 2.17 |
| nVidia GeForce GTX 780 | 81.66 | 393 | 2.08 |
| MSI Twin Frozr Gaming GTX 780 OC Edition | 82.42 | 434 | 1.89 |
| AMD Radeon HD 6950 | 36.83 | 204 | 1.81 |
| PowerColor LCS R9 290X OC 1200MHz / 1500MHz | 104.89 | 604 | 1.73 |
| nVidia GeForce GTX 780 Ti | 90.53 | 563 | 1.61 |
| nVidia GeForce GTX 580 | 50.49 | 340 | 1.49 |
| AMD Radeon HD 5870 | 35.98 | 252 | 1.43 |
| AMD Radeon HD 6970 | 41.32 | 310 | 1.33 |
| AMD Radeon HD 5850 | 30.05 | 245 | 1.23 |
| AMD Radeon HD 6990 | 73.96 | 671 | 1.10 |
| nVidia GeForce GTX TITAN | 85.05 | 833 | 1.02 |
| More is better | Less is better | More is better |
For the price we took the lowest price available on geizhals.eu.