ASUS Radeon R9 280X Matrix Platinum Review
Category : NVIDIA
Published by Christian Ney on 06.11.13
 Today we have a chance to take another look at ASUS' Radeon R9 280X Matrix Platinum graphics card since we encountered some problems with our sample that was acting odd. It was simply not stable and was giving strangely bad results in temperature and power consumption, so we have decided to stop by one of the local stores and actually buy a retail card to confirm or contradict the results. Thankfully, it turned out that our sample was really defective, as the new card did much better.
 Article in English Article in English |
 Artikel in Deutsch Artikel in Deutsch |
 Article en français Article en français |
 Articolo in italiano Articolo in italiano |

On the following pages we will show you the strengths and weaknesses of the ASUS Radeon R9 280X Matrix Platinum.
Technical Data / Specifications
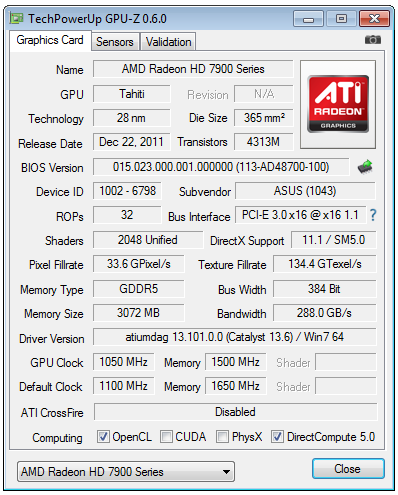
ASUS ships its Radeon R9 280X Matrix Platinum card with the core clocked at 1'100 MHz and the memory at 1'600 MHz (6'400 effective). Compared to the R9 280X reference clocks the Matrix Platinum has a nice factory overclocking with 100 MHz on the core and the memory. This makes the Matrix Platinum the second fastest Radeon R9 280X out of the box at this time after the Toxic from Sapphire.In the tested games we didn't see the PowerTune Boost in action, the card was always running at full speed of 1'150 MHz (under load). In Furmark though we did see it working, when running Furmatk the Matrix Platinum was going up and down from 1'100 MHz/1.256v to 950 MHz/1.2v.

| Matrix Platinum | DirectCU II Top | Radeon R9 280X | 7970 Matrix Platinum | |
| Chip | Tahiti XT2 | Tahiti XT2 | Tahiti XT2 | Tahiti XT2 |
| Process | 28 nm | 28 nm | 28 nm | 28 nm |
| Transistors | 4.31 billion | 4.31 billion | 4.31 billion | 4.31 billion |
| GPU clock | 1'100 MHz | 1'070 MHz | 1'000 MHz | 1'100 MHz |
| GPU Boost clock | N/A | N/A | N/A | N/A |
| Memory GDDR5 | 3'072 MB | 3'072 MB | 3'072 MB | 3'072 MB |
| Memory clock | 1'600 (6'400) MHz | 1'600 (6'400) MHz | 1'500 (6'000) MHz | 1'650 (6'600) MHz |
| Memory interface | 384 Bit | 384 Bit | 384 Bit | 384 Bit |
| Memory bandwidth | 307.2 GB/s | 307.2 GB/s | 288 GB/s | 316.8 GB/s |
| Shader Cores | 2'048 | 2'048 | 2'048 | 2'048 |
| TMUs | 128 | 128 | 128 | 128 |
| ROPs | 32 | 32 | 32 | 32 |
| TDP | xxx Watt | xxx Watt | 250 Watt | xxx Watt |
| PCB Type | Custom Design | Custom Design | Reference Design | Custom Design |
| Lenght (PCB - Total) | 28.5 - 28.5 cm | 26.8 - 28.7 cm | xx.x - xx.x cm | 28.5 - 28.5 cm |
| Height (PCB - Total) | 13.9 - 13.9 cm | 12.2 - 14.8 cm | xx.x - xx.x cm | 13.9 - 13.9 cm |
| Slots | 3 | 2 | 2 | 3 |
| Cooler | DirectCU II ROG | DirectCU II | AMD Reference | DirectCU II ROG |
| Launch Price | $XXX | $XXX | $299 | $XXX |
To cool its Radeon R9 280X Matrix Platinum, ASUS makes use of the same cooler you find on the Radeon HD 7970 Matrix, the DirectCU II ROG. When you put the two cards next to each other you don't see any difference. In this case you get two eight and three seven millimeter copper heatpipes (non nickel plated). The heatpipes are not in direct contact with the core like the manufacturer advertise, there is an extra metal plate in-between. Soldered to the heatpipes you find the fin stack which is being provided with fresh air via two 95mm fans. Both fans are identical, they carry the model number T129025SU and are being manufactured by Everflow. Overall the cooler is well made and finished, there is only the thermal paste which could have been better especially on such a high end card. The thermal paste used seems to be of mid quality, it is soft but looks dry.
Most memory chips are actively cooled by the metal plate that covers a big part of the PCB, they are in contact with the cooling unit thanks to thermal pads. There are only four memory chips that haven't been included in the loop, the ones on the right side of the GPU, because they are in the way of the heatpipes.

|
  
|
No surprise here too, the 7970 Matrix PCB put next to the R9 280X Matrix PCB shows no difference, they are identical. We are talking about a beefed up to the edge power implementation with 20 phases for the main power design. The GPU gets sixteen phases (there are five on the reference card), the memory two and the PLL (VDDCI) two.
The same metal plate that covers the memory chips is also providing active cooling to the MOSFETs via thermal pads. The manufacturer decided to equip its 280X with a full metal reinforcement (backplate) to prevent bending and also protect crucial components from potential damage. The 280X Matrix also features VGA Hotwire, instant voltage adjustment buttons, the safe mode button, the turbo fan button and soldering points.
Component wise, the Matrix complies with ASUS Super Alloy Power standard.
Checking the voltage regulation chip we find a digital multi-phase controller labelled Digi+ ASP1211 for the GPU, probably a rebranded CHiL 8228 or 8318. Additionally, there are two unidentified 2-phase controllers labelled 02=FF 42H on this card. The one closer to the PCIe power connectors is taking care of the memory and the one close to the BIOS switch is taking care of the PLL (VDDCI).

|
  
|
The memory chips used are made by SK Hynix and carry the model number H5GQ2H24AFR-R0C. They are specified to run at 1'500 MHz (6'000 MHz effective).

Preview


Delivery


The card ships well bolstered in a foam made mold. Bundled with the graphics card there is a software CD, an installation manual, three VGA Hotwire cables, a DVI to HDMI converter, a soft CrossFire bridge, a SteelSeries Diablo III mousepad and the LN2 Mos Heatsink.
Test Setup
Hardware
| Mainboard |
|
| CPUs |
|
| Memory |
|
| Graphic Cards (Driver) |
|
| Drivers |
|
| Games and OS |
|
| HDD |
|
| PSU |
|


3DMark - Fire Strike Performance

| Graphics Cards | Score | Graphics Score |
| nVidia GeForce GTX TITAN | 8'396 | 9'420 |
| nVidia GeForce GTX 780 | 7'877 | 8'734 |
| ASUS Radeon R9 280X Matrix Platinum | 7'554 | 8'458 |
| ASUS Radeon R9 280X DirectCU II Top | 7'437 | 8'273 |
| AMD Radeon HD 7970 GHz Edition | 7'091 | 7'922 |
| AMD Radeon R9 280X | 7'093 | 7'837 |
| nVidia GeForce GTX 770 | 6'679 | 7'408 |
| AMD Radeon HD 7970 | 6'578 | 7'215 |
| AMD Radeon HD 6990 | 6'350 | 7'207 |
| nVidia GeForce GTX 680 | 6'402 | 7'102 |
| nVidia GeForce GTX 670 | 5'624 | 6'099 |
| AMD Radeon R9 270X | 5'318 | 5'784 |
| nVidia GeForce GTX 760 | 5'243 | 5'645 |
| AMD Radeon HD 7870 | 5'009 | 5'436 |
| nVidia GeForce GTX 660 Ti | 4'885 | 5'270 |
| nVidia GeForce GTX 580 | 4'545 | 4'975 |
| nVidia GeForce GTX 660 | 4'415 | 4'707 |
| AMD Radeon HD 7850 | 4'176 | 4'460 |
| nVidia GeForce GTX 650 Ti Boost | 3'762 | 3'962 |
| AMD Radeon HD 6970 | 3'742 | 3'880 |
| AMD Radeon HD 7790 | 3'546 | 3'823 |
| AMD Radeon HD 6950 | 3'338 | 3'446 |
| AMD Radeon HD 5870 | 3'232 | 3'299 |
| nVidia GeForce GTX 650 Ti | 3'031 | 3'182 |
| AMD Radeon HD 6870 | 2'991 | 3'096 |
| AMD Radeon HD 5850 | 2'710 | 2'751 |
| More is better | ||

3DMark - Fire Strike Extreme

| Graphics Cards | Score | Graphics Score |
| nVidia GeForce GTX TITAN | 4'271 | 4'420 |
| nVidia GeForce GTX 780 | 4'007 | 4'121 |
| ASUS Radeon R9 280X Matrix Platinum | 3'829 | 3'967 |
| ASUS Radeon R9 280X DirectCU II Top | 3'746 | 3'880 |
| AMD Radeon HD 7970 GHz Edition | 3'568 | 3'720 |
| AMD Radeon R9 280X | 3'564 | 3'668 |
| nVidia GeForce GTX 770 | 3'319 | 3'448 |
| AMD Radeon HD 6990 | 3'185 | 3'274 |
| AMD Radeon HD 7970 | 3'291 | 3'383 |
| nVidia GeForce GTX 680 | 3'176 | 3'286 |
| nVidia GeForce GTX 670 | 2'805 | 2'872 |
| AMD Radeon R9 270X | 2'657 | 2'739 |
| nVidia GeForce GTX 760 | 2'610 | 2'655 |
| AMD Radeon HD 7870 | 2'484 | 2'560 |
| nVidia GeForce GTX 660 Ti | 2'378 | 2'440 |
| nVidia GeForce GTX 580 | 2'213 | 2'350 |
| nVidia GeForce GTX 660 | 2'178 | 2'202 |
| AMD Radeon HD 7850 | 2'044 | 2'073 |
| nVidia GeForce GTX 650 Ti Boost | 1'842 | 1'848 |
| AMD Radeon HD 6970 | 1'784 | 1'760 |
| AMD Radeon HD 6950 | 1'585 | 1'555 |
| AMD Radeon HD 7790 | 1'456 | 1'437 |
| AMD Radeon HD 6870 | 1'101 | 1'025 |
| AMD Radeon HD 5870 | 1'005 | 1'005 |
| nVidia GeForce GTX 650 Ti | 942 | 983 |
| AMD Radeon HD 5850 | 959 | 878 |
| More is better | ||

Unigine Heaven 4.0 Extreme Preset

| Graphics Cards | Score | fps |
| nVidia GeForce GTX TITAN | 1'594 | 63.3 |
| nVidia GeForce GTX 780 | 1'537 | 61.0 |
| nVidia GeForce GTX 680 | 1'261 | 50.0 |
| nVidia GeForce GTX 770 | 1'204 | 47.8 |
| ASUS Radeon R9 280X Matrix Platinum | 1'204 | 47.8 |
| ASUS Radeon R9 280X DirectCU II Top | 1'178 | 46.7 |
| AMD Radeon HD 6990 | 1'156 | 45.9 |
| AMD Radeon HD 7970 GHz Edition | 1'137 | 45.1 |
| AMD Radeon R9 280X | 1'113 | 44.2 |
| AMD Radeon HD 7970 | 1'034 | 41.1 |
| nVidia GeForce GTX 670 | 1'028 | 40.8 |
| nVidia GeForce GTX 760 | 951 | 37.8 |
| nVidia GeForce GTX 580 | 915 | 36.3 |
| AMD Radeon R9 270X | 886 | 35.2 |
| nVidia GeForce GTX 660 Ti | 866 | 34.4 |
| AMD Radeon HD 7870 | 826 | 32.8 |
| nVidia GeForce GTX 660 | 801 | 31.8 |
| nVidia GeForce GTX 650 Ti Boost | 705 | 28.0 |
| AMD Radeon HD 7850 | 684 | 27.2 |
| AMD Radeon HD 6970 | 620 | 24.6 |
| AMD Radeon HD 7790 | 568 | 22.5 |
| AMD Radeon HD 6950 | 556 | 22.1 |
| AMD Radeon HD 6870 | 510 | 20.3 |
| nVidia GeForce GTX 650 Ti | 498 | 19.8 |
| AMD Radeon HD 5870 | 478 | 19.0 |
| AMD Radeon HD 5850 | 403 | 16.0 |
| More is better | ||
BattleField 3

| High Preset, 1920x1080, 4xMSAA, Ultra, SSAO | Average FPS |
| nVidia GeForce GTX TITAN | 96.4 |
| nVidia GeForce GTX 780 | 90.4 |
| ASUS Radeon R9 280X Matrix Platinum | 83.4 |
| ASUS Radeon R9 280X DirectCU II Top | 81.6 |
| AMD Radeon HD 7970 GHz Edition | 78.4 |
| AMD Radeon R9 280X | 76.6 |
| nVidia GeForce GTX 770 | 76.6 |
| nVidia GeForce GTX 680 | 72.8 |
| AMD Radeon HD 7970 | 71.2 |
| nVidia GeForce GTX 670 | 66.0 |
| AMD Radeon HD 6990 | 65.6 |
| nVidia GeForce GTX 760 | 62.0 |
| AMD Radeon R9 270X | 58.2 |
| nVidia GeForce GTX 660 Ti | 55.8 |
| AMD Radeon HD 7870 | 54.2 |
| nVidia GeForce GTX 660 | 50.6 |
| nVidia GeForce GTX 580 | 48.6 |
| AMD Radeon HD 7850 | 44.6 |
| nVidia GeForce GTX 650 Ti Boost | 44.2 |
| AMD Radeon HD 7790 | 36.6 |
| AMD Radeon HD 6970 | 35.8 |
| nVidia GeForce GTX 650 Ti | 33.2 |
| AMD Radeon HD 5870 | 32.6 |
| AMD Radeon HD 6950 | 32.0 |
| AMD Radeon HD 6870 | 29.8 |
| AMD Radeon HD 5850 | 26.6 |
| More is better |

Borderlands 2

| High Preset, 1920x1080, FXAA, no PhsyX, High | Average FPS |
| nVidia GeForce GTX 780 | 131.6 |
| nVidia GeForce GTX TITAN | 128.8 |
| AMD Radeon HD 6990 | 128.6 |
| ASUS Radeon R9 280X Matrix Platinum | 121.6 |
| ASUS Radeon R9 280X DirectCU II Top | 119.2 |
| nVidia GeForce GTX 770 | 118.6 |
| nVidia GeForce GTX 680 | 117.0 |
| AMD Radeon HD 7970 GHz Edition | 115.6 |
| AMD Radeon R9 280X | 112.8 |
| nVidia GeForce GTX 670 | 110.5 |
| AMD Radeon HD 7970 | 105.2 |
| nVidia GeForce GTX 760 | 102.2 |
| nVidia GeForce GTX 660 Ti | 93.8 |
| nVidia GeForce GTX 580 | 89.6 |
| nVidia GeForce GTX 660 | 85.6 |
| AMD Radeon R9 270X | 82.8 |
| AMD Radeon HD 7870 | 76.6 |
| AMD Radeon HD 6970 | 75.2 |
| nVidia GeForce GTX 650 Ti Boost | 74.8 |
| AMD Radeon HD 6950 | 66.8 |
| AMD Radeon HD 7850 | 66.8 |
| AMD Radeon HD 5870 | 66.4 |
| AMD Radeon HD 6870 | 58.2 |
| AMD Radeon HD 5850 | 55.4 |
| nVidia GeForce GTX 650 Ti | 54.8 |
| AMD Radeon HD 7790 | 54.6 |
| More is better |


Bioshock Infinite - Benchmark

| Ultra Preset, 1920x1080, AA, no DDOF | Average FPS |
| nVidia GeForce GTX TITAN | 95.55 |
| nVidia GeForce GTX 780 | 90.78 |
| ASUS Radeon R9 280X Matrix Platinum | 81.00 |
| ASUS Radeon R9 280X DirectCU II Top | 79.38 |
| nVidia GeForce GTX 770 | 78.98 |
| AMD Radeon HD 6990 | 78.01 |
| AMD Radeon HD 7970 GHz Edition | 76.80 |
| nVidia GeForce GTX 680 | 75.68 |
| AMD Radeon R9 280X | 75.44 |
| AMD Radeon HD 7970 | 70.13 |
| nVidia GeForce GTX 670 | 67.87 |
| nVidia GeForce GTX 760 | 62.41 |
| nVidia GeForce GTX 660 Ti | 60.36 |
| AMD Radeon R9 270X | 54.79 |
| nVidia GeForce GTX 660 | 52.91 |
| nVidia GeForce GTX 580 | 51.04 |
| AMD Radeon HD 7870 | 50.55 |
| nVidia GeForce GTX 650 Ti Boost | 45.77 |
| AMD Radeon HD 6970 | 43.20 |
| AMD Radeon HD 7850 | 43.13 |
| AMD Radeon HD 5870 | 39.28 |
| AMD Radeon HD 6950 | 38.13 |
| nVidia GeForce GTX 650 Ti | 34.89 |
| AMD Radeon HD 7790 | 34.65 |
| AMD Radeon HD 6870 | 33.69 |
| AMD Radeon HD 5850 | 32.42 |
| More is better |

Crysis 3

| High Preset, 1920x1080, 8xMSAA, Very High | Average FPS |
| nVidia GeForce GTX TITAN | 31.8 |
| nVidia GeForce GTX 780 | 30.2 |
| AMD Radeon HD 6990 | 26.8 |
| nVidia GeForce GTX 770 | 25.8 |
| nVidia GeForce GTX 680 | 24.4 |
| nVidia GeForce GTX 670 | 22.2 |
| ASUS Radeon R9 280X Matrix Platinum | 20.8 |
| ASUS Radeon R9 280X DirectCU II Top | 20.6 |
| nVidia GeForce GTX 760 | 20.4 |
| AMD Radeon HD 7970 GHz Edition | 19.8 |
| AMD Radeon R9 280X | 19.4 |
| nVidia GeForce GTX 660 Ti | 18.8 |
| AMD Radeon HD 7970 | 18.4 |
| nVidia GeForce GTX 580 | 17.0 |
| nVidia GeForce GTX 660 | 16.8 |
| nVidia GeForce GTX 650 Ti Boost | 15.0 |
| AMD Radeon R9 270X | 15.0 |
| AMD Radeon HD 6970 | 14.6 |
| AMD Radeon HD 7870 | 14.2 |
| AMD Radeon HD 6950 | 12.2 |
| AMD Radeon HD 7850 | 11.8 |
| nVidia GeForce GTX 650 Ti | 10.2 |
| AMD Radeon HD 6870 | 8.4 |
| AMD Radeon HD 7790 | 8.0 |
| AMD Radeon HD 5870 | 8.0 |
| AMD Radeon HD 5850 | 7.6 |
| More is better |


Call of Duty Black Ops 2

| High Preset, 1920x1080, 8xMSAA, High | Average FPS |
| nVidia GeForce GTX TITAN | 130.2 |
| AMD Radeon HD 6990 | 127.0 |
| nVidia GeForce GTX 780 | 121.0 |
| ASUS Radeon R9 280X Matrix Platinum | 109.6 |
| nVidia GeForce GTX 770 | 109.0 |
| ASUS Radeon R9 280X DirectCU II Top | 107.2 |
| nVidia GeForce GTX 680 | 105.4 |
| AMD Radeon HD 7970 GHz Edition | 103.6 |
| AMD Radeon R9 280X | 102.8 |
| nVidia GeForce GTX 670 | 95.8 |
| AMD Radeon HD 7970 | 93.2 |
| nVidia GeForce GTX 760 | 86.0 |
| AMD Radeon R9 270X | 84.4 |
| nVidia GeForce GTX 580 | 81.8 |
| nVidia GeForce GTX 660 Ti | 81.4 |
| AMD Radeon HD 7870 | 79.2 |
| nVidia GeForce GTX 660 | 72.0 |
| AMD Radeon HD 7850 | 69.0 |
| AMD Radeon HD 6970 | 68.6 |
| AMD Radeon HD 5870 | 64.6 |
| AMD Radeon HD 6950 | 62.4 |
| nVidia GeForce GTX 650 Ti Boost | 62.4 |
| AMD Radeon HD 6870 | 58.4 |
| AMD Radeon HD 5850 | 54.4 |
| nVidia GeForce GTX 650 Ti | 48.2 |
| AMD Radeon HD 7790 | 46.4 |
| More is better |

DIRT Showdown - Benchmark

| High Preset, 1920x1080, 8xMSAA, Ultra | Average FPS |
| nVidia GeForce GTX TITAN | 87.97 |
| ASUS Radeon R9 280X Matrix Platinum | 82.72 |
| nVidia GeForce GTX 780 | 82.36 |
| ASUS Radeon R9 280X DirectCU II Top | 80.48 |
| AMD Radeon HD 6990 | 80.30 |
| AMD Radeon HD 7970 GHz Edition | 79.22 |
| AMD Radeon R9 280X | 76.46 |
| AMD Radeon HD 7970 | 71.63 |
| nVidia GeForce GTX 770 | 68.79 |
| nVidia GeForce GTX 680 | 67.04 |
| AMD Radeon R9 270X | 64.63 |
| AMD Radeon HD 7870 | 62.53 |
| nVidia GeForce GTX 670 | 58.98 |
| nVidia GeForce GTX 660 Ti | 54.27 |
| nVidia GeForce GTX 760 | 52.48 |
| AMD Radeon HD 7850 | 50.61 |
| nVidia GeForce GTX 580 | 48.92 |
| nVidia GeForce GTX 660 | 45.35 |
| AMD Radeon HD 6970 | 44.19 |
| AMD Radeon HD 7790 | 43.28 |
| AMD Radeon HD 6950 | 38.94 |
| nVidia GeForce GTX 650 Ti Boost | 38.02 |
| AMD Radeon HD 5870 | 36.48 |
| nVidia GeForce GTX 650 Ti | 30.35 |
| AMD Radeon HD 6870 | 30.05 |
| AMD Radeon HD 5850 | 29.13 |
| More is better |


Far Cry 3

| High Preset, 1920x1080, 8xMSAA, Ultra | Average FPS |
| nVidia GeForce GTX TITAN | 50.2 |
| nVidia GeForce GTX 780 | 47.2 |
| AMD Radeon HD 6990 | 39.8 |
| nVidia GeForce GTX 770 | 38.2 |
| nVidia GeForce GTX 680 | 35.6 |
| ASUS Radeon R9 280X Matrix Platinum | 32.4 |
| nVidia GeForce GTX 670 | 32.2 |
| ASUS Radeon R9 280X DirectCU II Top | 31.8 |
| AMD Radeon HD 7970 GHz Edition | 31.0 |
| AMD Radeon R9 280X | 30.0 |
| nVidia GeForce GTX 760 | 29.4 |
| AMD Radeon HD 7970 | 27.8 |
| nVidia GeForce GTX 660 Ti | 27.0 |
| nVidia GeForce GTX 580 | 24.8 |
| nVidia GeForce GTX 660 | 24.6 |
| AMD Radeon R9 270X | 23.8 |
| AMD Radeon HD 7870 | 22.4 |
| nVidia GeForce GTX 650 Ti Boost | 21.2 |
| AMD Radeon HD 6970 | 20.6 |
| AMD Radeon HD 6950 | 18.0 |
| AMD Radeon HD 7850 | 17.8 |
| nVidia GeForce GTX 650 Ti | 15.4 |
| AMD Radeon HD 5870 | 15.2 |
| AMD Radeon HD 6870 | 13.0 |
| AMD Radeon HD 5850 | 13.0 |
| AMD Radeon HD 7790 | 10.6 |
| More is better |

Sleeping Dogs - Benchmark

| High Preset, 1920x1080, Extreme, High-Res Textures | Average FPS |
| nVidia GeForce GTX TITAN | 62.4 |
| nVidia GeForce GTX 780 | 58.7 |
| AMD Radeon HD 6990 | 56.6 |
| ASUS Radeon R9 280X Matrix Platinum | 54.9 |
| ASUS Radeon R9 280X DirectCU II Top | 53.7 |
| AMD Radeon HD 7970 GHz Edition | 51.7 |
| nVidia GeForce GTX 770 | 51.7 |
| AMD Radeon R9 280X | 50.7 |
| nVidia GeForce GTX 680 | 48.7 |
| AMD Radeon HD 7970 | 47.0 |
| nVidia GeForce GTX 670 | 42.7 |
| nVidia GeForce GTX 760 | 38.7 |
| nVidia GeForce GTX 660 Ti | 38.7 |
| AMD Radeon R9 270X | 36.4 |
| nVidia GeForce GTX 580 | 35.1 |
| AMD Radeon HD 7870 | 33.8 |
| nVidia GeForce GTX 660 | 32.0 |
| AMD Radeon HD 6970 | 30.0 |
| AMD Radeon HD 7850 | 27.6 |
| AMD Radeon HD 5870 | 27.3 |
| nVidia GeForce GTX 650 Ti Boost | 26.3 |
| AMD Radeon HD 6950 | 26.2 |
| AMD Radeon HD 6870 | 22.9 |
| AMD Radeon HD 7790 | 22.2 |
| AMD Radeon HD 5850 | 22.2 |
| nVidia GeForce GTX 650 Ti | 19.9 |
| More is better |

The Elder Scrolls V: Skyrim

| High Preset, 1920x1080, 8xAA, Ultra | Average FPS |
| nVidia GeForce GTX TITAN | 127.2 |
| nVidia GeForce GTX 780 | 126.2 |
| ASUS Radeon R9 280X Matrix Platinum | 115.8 |
| ASUS Radeon R9 280X DirectCU II Top | 113.0 |
| AMD Radeon HD 7970 GHz Edition | 110.4 |
| AMD Radeon HD 6990 | 109.2 |
| nVidia GeForce GTX 770 | 109.0 |
| nVidia GeForce GTX 680 | 106.4 |
| AMD Radeon R9 280X | 106.0 |
| AMD Radeon HD 7970 | 98.6 |
| nVidia GeForce GTX 670 | 96.4 |
| AMD Radeon R9 270X | 90.4 |
| nVidia GeForce GTX 760 | 87.6 |
| AMD Radeon HD 7870 | 85.2 |
| nVidia GeForce GTX 580 | 84.8 |
| nVidia GeForce GTX 660 Ti | 81.4 |
| nVidia GeForce GTX 660 | 73.0 |
| AMD Radeon HD 7850 | 71.0 |
| AMD Radeon HD 6970 | 64.0 |
| nVidia GeForce GTX 650 Ti Boost | 63.2 |
| AMD Radeon HD 6950 | 58.4 |
| AMD Radeon HD 5870 | 56.6 |
| AMD Radeon HD 7790 | 56.2 |
| AMD Radeon HD 6870 | 52.0 |
| AMD Radeon HD 5850 | 48.6 |
| nVidia GeForce GTX 650 Ti | 47.2 |
| More is better |

Metro: Last Light - Benchmark

| Very High, 1920x1080, SSAA, DX11 | Average FPS |
| nVidia GeForce GTX TITAN | 39.94 |
| nVidia GeForce GTX 780 | 38.18 |
| ASUS Radeon R9 280X Matrix Platinum | 36.15 |
| ASUS Radeon R9 280X DirectCU II Top | 35.28 |
| AMD Radeon R9 280X | 33.78 |
| AMD Radeon HD 7970 GHz Edition | 33.41 |
| nVidia GeForce GTX 770 | 32.53 |
| AMD Radeon HD 7970 | 30.98 |
| nVidia GeForce GTX 680 | 30.56 |
| AMD Radeon HD 6990 | 27.65 |
| nVidia GeForce GTX 670 | 27.30 |
| nVidia GeForce GTX 760 | 25.09 |
| nVidia GeForce GTX 660 Ti | 23.97 |
| AMD Radeon R9 270X | 23.46 |
| nVidia GeForce GTX 580 | 23.25 |
| AMD Radeon HD 7870 | 21.58 |
| nVidia GeForce GTX 660 | 20.84 |
| AMD Radeon HD 7850 | 18.09 |
| nVidia GeForce GTX 650 Ti Boost | 17.83 |
| AMD Radeon HD 6970 | 17.05 |
| AMD Radeon HD 6950 | 15.22 |
| AMD Radeon HD 7790 | 14.94 |
| nVidia GeForce GTX 650 Ti | 13.83 |
| AMD Radeon HD 5870 | 13.33 |
| AMD Radeon HD 6870 | 12.37 |
| AMD Radeon HD 5850 | 11.11 |
| More is better |

Grand Theft Auto V

Power Consumption

| Power Consumption Idle* | Watts |
| AMD Radeon HD 6990 (Ref) | 80 |
| nVidia GeForce GTX 580 (Ref) | 69 |
| AMD Radeon HD 7970 GHz Edition (ASUS Matrix P.) | 60 |
| ASUS Radeon R9 280X Matrix Platinum Retail | 58 |
| ASUS Radeon R9 280X Matrix Platinum Sample | 58 |
| AMD Radeon HD 6970 (Ref) | 57 |
| AMD Radeon HD 6950 (Ref) | 57 |
| AMD Radeon HD 5850 (Ref) | 56 |
| AMD Radeon HD 6870 (Ref) | 54 |
| nVidia GeForce GTX 780 (ASUS DC2OC) | 54 |
| nVidia GeForce GTX 660 Ti (ASUS DC2T) | 54 |
| AMD Radeon HD 5870 (Ref) | 53 |
| nVidia GeForce GTX 770 (ASUS DC2OC) | 53 |
| nVidia GeForce GTX 670 (ASUS DC2T) | 52 |
| nVidia GeForce GTX 680 (Ref) | 51 |
| nVidia GeForce GTX 660 (ASUS DC2T) | 50 |
| AMD Radeon HD 7870 (ASUS DC2T V2) | 48 |
| ASUS Radeon R9 280X DirectCU II Top | 48 |
| AMD Radeon R9 280X (ASUS DC2T) | 48 |
| AMD Radeon R9 270X (ASUS DC2T) | 48 |
| AMD Radeon HD 7970 (XFX DD - Ref PCB) | 47 |
| nVidia GeForce GTX TITAN (Ref) | 47 |
| nVidia GeForce GTX 650 Ti (ASUS DC2T) | 45 |
| AMD Radeon HD 7850 (ASUS DC2T) | 45 |
| AMD Radeon HD 7790 (ASUS DC2OC - Ref PCB) | 45 |
| nVidia GeForce GTX 760 (ASUS DC2OC) | 45 |
| nVidia GeForce GTX 650 Ti Boost (Ref) | 43 |
| *Entire system | Less is better |
| Power Consumption Load (FurMark)* | Watts |
| AMD Radeon HD 6990 (Ref) | 481 |
| ASUS Radeon R9 280X Matrix Platinum Sample | 379 |
| ASUS Radeon R9 280X Matrix Platinum Retail | 363 |
| AMD Radeon HD 7970 GHz Edition (ASUS Matrix P.) | 360 |
| ASUS Radeon R9 280X DirectCU II Top | 345 |
| AMD Radeon HD 7970 (XFX DD - Ref PCB) | 323 |
| AMD Radeon R9 280X (ASUS DC2T) | 320 |
| nVidia GeForce GTX TITAN (Ref) | 306 |
| nVidia GeForce GTX 780 (ASUS DC2OC) | 302 |
| nVidia GeForce GTX 680 (Ref) | 258 |
| nVidia GeForce GTX 770 (ASUS DC2OC) | 257 |
| nVidia GeForce GTX 580 (Ref) | 254 |
| AMD Radeon HD 6970 (Ref) | 244 |
| AMD Radeon HD 5870 (Ref) | 232 |
| nVidia GeForce GTX 670 (ASUS DC2T) | 227 |
| AMD Radeon R9 270X (ASUS DC2T) | 223 |
| AMD Radeon HD 7870 (ASUS DC2T V2) | 220 |
| nVidia GeForce GTX 760 (ASUS DC2OC) | 218 |
| AMD Radeon HD 6950 (Ref) | 208 |
| AMD Radeon HD 6870 (Ref) | 200 |
| AMD Radeon HD 7850 (ASUS DC2T) | 195 |
| AMD Radeon HD 5850 (Ref) | 193 |
| nVidia GeForce GTX 660 Ti (ASUS DC2T) | 178 |
| nVidia GeForce GTX 660 (ASUS DC2T) | 177 |
| nVidia GeForce GTX 650 Ti Boost (Ref) | 169 |
| AMD Radeon HD 7790 (ASUS DC2OC - Ref PCB) | 152 |
| nVidia GeForce GTX 650 Ti (ASUS DC2T) | 151 |
| *Entire system | Less is better |
| Difference Idle/LoadDifférence Idle/Charge | Watts |
| AMD Radeon HD 6990 (Ref) | 401 |
| ASUS Radeon R9 280X Matrix Platinum Sample | 321 |
| ASUS Radeon R9 280X Matrix Platinum Retail | 305 |
| AMD Radeon HD 7970 GHz Edition (ASUS Matrix P.) | 300 |
| ASUS Radeon R9 280X DirectCU II Top | 297 |
| AMD Radeon HD 7970 (XFX DD - Ref PCB) | 276 |
| AMD Radeon R9 280X (ASUS DC2T) | 272 |
| nVidia GeForce GTX TITAN (Ref) | 259 |
| nVidia GeForce GTX 780 (ASUS DC2OC) | 248 |
| nVidia GeForce GTX 680 (Ref) | 207 |
| nVidia GeForce GTX 770 (ASUS DC2OC) | 204 |
| AMD Radeon HD 6970 (Ref) | 187 |
| nVidia GeForce GTX 580 (Ref) | 185 |
| AMD Radeon HD 5870 (Ref) | 179 |
| AMD Radeon R9 270X (ASUS DC2T) | 175 |
| nVidia GeForce GTX 670 (ASUS DC2T) | 175 |
| nVidia GeForce GTX 760 (ASUS DC2OC) | 173 |
| AMD Radeon HD 7870 (ASUS DC2T V2) | 172 |
| AMD Radeon HD 6950 (Ref) | 151 |
| AMD Radeon HD 7850 (ASUS DC2T) | 150 |
| AMD Radeon HD 6870 (Ref) | 146 |
| AMD Radeon HD 5850 (Ref) | 137 |
| nVidia GeForce GTX 660 (ASUS DC2T) | 127 |
| nVidia GeForce GTX 650 Ti Boost (Ref) | 126 |
| nVidia GeForce GTX 660 Ti (ASUS DC2T) | 124 |
| AMD Radeon HD 7790 (ASUS DC2OC - Ref PCB) | 107 |
| nVidia GeForce GTX 650 Ti (ASUS DC2T) | 106 |
| *Entire system | More is better |

Fan Speed / Noise Level
Fan Speed

Noise Level

For the noise level results, we measured the noise level using a decibel meter (Voltcraft SL-200) located at 1 meter away from the graphics card.
Idle / FurMark / BF3
Idle Temperature

Idle, temperature is taken after 15 minutes @ lowest, 40 %, 50 %, 70 % and 100 % fan speed.
Room Temperature: 25°C
Temperature under Furmark

For FurMark, temperature is taken after 15 minutes of GPU Burn test at lowest, 40 %, 50 %, 70 % and 100 % fan speed.
We stopped the test when the GPU temperature hit 90°C.
Room Temperature: 25°C
Temperature and fan speed under BattleField 3

For BattleField 3, temperature and fan speed values taken, are the highest achieved after 1 hour gaming @ auto fan speed.
Performance/Watt
| Graphics Cards | Performance Index | Power C. (Watts)* | Performance/Watt*10 |
| nVidia GeForce GTX 660 Ti (ASUS DC2T) | 53.55 | 178 | 3.01 |
| nVidia GeForce GTX TITAN (Ref) | 85.05 | 306 | 2.78 |
| nVidia GeForce GTX 770 (ASUS DC2OC) | 70.92 | 257 | 2.76 |
| nVidia GeForce GTX 670 (ASUS DC2T) | 62.00 | 227 | 2.73 |
| nVidia GeForce GTX 780 (ASUS DC2OC) | 81.66 | 302 | 2.70 |
| nVidia GeForce GTX 660 (ASUS DC2T) | 47.37 | 177 | 2.68 |
| nVidia GeForce GTX 680 (Ref) | 68.36 | 258 | 2.65 |
| nVidia GeForce GTX 760 (ASUS DC2OC) | 56.63 | 218 | 2.60 |
| nVidia GeForce GTX 650 Ti Boost (Ref) | 40.87 | 169 | 2.42 |
| AMD Radeon R9 270X (ASUS DC2T) | 53.39 | 223 | 2.39 |
| AMD Radeon HD 7870 (ASUS DC2T V2) | 50.03 | 220 | 2.27 |
| AMD Radeon HD 7850 (ASUS DC2T) | 42.04 | 195 | 2.16 |
| AMD Radeon HD 7790 (ASUS DC2OC - Ref PCB) | 32.75 | 152 | 2.15 |
| AMD Radeon R9 280X (ASUS DC2T) | 68.40 | 320 | 2.14 |
| ASUS Radeon R9 280X DirectCU II Top | 72.22 | 345 | 2.09 |
| nVidia GeForce GTX 650 Ti (ASUS DC2T) | 30.8 | 151 | 2.04 |
| ASUS Radeon R9 280X Matrix Platinum Retail | 73.84 | 363 | 2.03 |
| nVidia GeForce GTX 580 (Ref) | 50.49 | 254 | 1.99 |
| AMD Radeon HD 7970 (XFX DD - Ref PCB) | 63.41 | 323 | 1.96 |
| ASUS Radeon R9 280X Matrix Platinum Sample | 73.84 | 379 | 1.95 |
| AMD Radeon HD 7970 GHz Edition (ASUS Matrix P.) | 69.99 | 360 | 1.94 |
| AMD Radeon HD 6950 (Ref) | 36.83 | 208 | 1.77 |
| AMD Radeon HD 6970 (Ref) | 41.32 | 244 | 1.69 |
| AMD Radeon HD 6870 (Ref) | 31.88 | 200 | 1.59 |
| AMD Radeon HD 5850 (Ref) | 30.05 | 193 | 1.56 |
| AMD Radeon HD 5870 (Ref) | 35.98 | 232 | 1.55 |
| AMD Radeon HD 6990 (Ref) | 73.96 | 481 | 1.54 |
| *Entire system | More is better | Less is better | More is better |
The "Performance Index" value is calculated as the sum of all benchmarks results divided by the amount of games (3DMark and Ungine not included into the calculation).
Performance/Price
| Graphics Cards | Performance Index | Price (€)* | Performance/€*10 |
| nVidia GeForce GTX 650 Ti Boost | 40.87 | 108 | 3.78 |
| AMD Radeon HD 7870 | 50.03 | 140 | 3.57 |
| AMD Radeon HD 7790 | 32.75 | 95 | 3.45 |
| nVidia GeForce GTX 660 | 47.37 | 143 | 3.31 |
| AMD Radeon HD 7850 | 40.04 | 121 | 3.31 |
| AMD Radeon R9 270X | 53.39 | 160 | 3.34 |
| nVidia GeForce GTX 650 Ti | 30.80 | 100 | 3.11 |
| nVidia GeForce GTX 670 | 62.00 | 204 | 3.04 |
| nVidia GeForce GTX 660 Ti | 53.55 | 176 | 2.91 |
| nVidia GeForce GTX 760 | 56.63 | 199 | 2.85 |
| AMD Radeon R9 280X | 68.40 | 240 | 2.85 |
| AMD Radeon HD 7970 | 63.41 | 229 | 2.77 |
| AMD Radeon HD 7970 GHz Edition | 69.99 | 254 | 2.76 |
| nVidia GeForce GTX 770 | 70.92 | 258 | 2.75 |
| ASUS Radeon R9 280X DirectCU II Top | 72.22 | 273 | 2.65 |
| AMD Radeon HD 6870 | 31.88 | 124 | 2.57 |
| nVidia GeForce GTX 680 | 68.36 | 283 | 2.42 |
| nVidia GeForce GTX 580 | 50.49 | 221 | 2.28 |
| ASUS Radeon R9 280X Matrix Platinum | 73.84 | 326 | 2.27 |
| nVidia GeForce GTX 780 | 81.66 | 411 | 1.99 |
| AMD Radeon HD 6950 | 36.83 | 204 | 1.81 |
| AMD Radeon HD 5870 | 35.98 | 246 | 1.46 |
| AMD Radeon HD 5850 | 30.05 | 221 | 1.36 |
| AMD Radeon HD 6970 | 41.32 | 310 | 1.33 |
| AMD Radeon HD 6990 | 73.96 | 657 | 1.13 |
| nVidia GeForce GTX TITAN | 85.05 | 821 | 1.04 |
| * 05/11/2013 | More is better | Less is better | More is better |
For the price we took the lowest price available on geizhals.eu.
Conclusion
| General | + | - | |
| While our sample was behaving quite strangely and showed high power
consumption and temperatures which resulted in a low score on our
original ASUS Radeon R9 280X Matrix Platinum review, the one that we got from
retail/e-tail worked like a charm, so thankfully the problem was only
with the sample. Those results also influenced noise levels as well. The new Radeon R9 280X Matrix Platinum definitely offers great performance, has one of the best designs on the market, comes with a decent factory overclock and offers quite good overclocking features. Paired up with one of the top graphics card coolers on the market, it is definitely one of the R9 280X graphics cards that you should keep your eye on. We also have to point out that the Radeon 200 series is currently not a part of the Never Settle Forever program. This may change in the future but at the moment you don't get any free games for buying a Radeon 200 series graphics card unless the manufacturer specifies otherwise. Other than the lack of games, the bundle is good, as you get everything you would expect to get with such a graphics card. |
- Performance - Design - Factory Overclocking - Power Design - Overclocking features - Cooling - Bundle |
-
Price - No game bundle |
|
| Cooling / Noise Level | + | - | |
| As noted, the ASUS Radeon R9 280X Matrix Platinum uses the same
cooler that we had previously seen on the Radeon HD 7970 Matrix and the
performance on both graphics cards is quite close. This is definitely
not a bad thing considering that it already did a great job back on the
Radeon HD 7970 Matrix and its noise levels are impressive as even under
load, the R9 280X Matrix is quite silent. There are some drawbacks as well. Despite the fact that we are looking at a triple-slot cooler, it actually had slightly worse temperature results when compared to the DirectCU II dual-slot cooler found on the TOP version of the same graphics card. These are mostly attributed to the extra copper plate placed between the core and the heatpipes on the Matrix cooler as well as higher voltage of 1.256V compared to 1.15V on the DirectCU II Top version. |
- Cooling performance - Noise levels |
||
| Performance | + | - | |
| The ASUS Radeon R9 280 Matrix Platinum is definitely a fast
graphics card and ends up around 7.8% faster on average when compared to
the reference design R9 280X. Unfortunately, it is not clocked any
higher than the Radeon HD 7970 Matrix which even has a slightly higher
1'650 MHz clocked memory while R9 280X Matrix ends up at 1'600 MHz. The HD
7970 Matrix also never throttled down while R9 280X Matrix does, which is a
result of the new PowerTune Boost. The power consumption under load is higher than on other graphics cards and since it does not offer much more performance gain it has a slightly lower performance-per-watt. On the other hand, the power consumption of the whole system in idle is quite high at 58W, when compared to the 48W with the DirectCU II TOP version. |
- Performance | - Performance/Watt
- Power consumption in idle |
|
| Recommendation / Price | + | - | |
| The ASUS Radeon R9 280X Matrix Platinum scored 2.5 stars
in our old review due to a defective sample. The one that we picked up
from retail did much better and it appears that the price is left as the
only issue. With a starting price of 326 Euros excluding shipping costs across the EU, the 280X Matrix Platinum is too expensive. That's about 86 Euros on top of the cheapest R9 280X for example. The price cannot be justified by what you get since you could get the Radeon HD 7970 Matrix Platinum which is basically the same card for only 250 Euros. Furthermore the Radeon HD 7970 Matrix comes with the Never Settle Forever Bundle. As a result we simply cannot recommend the 280X Matrix. If one really wants a graphics card like the Radeon R9 280X Matrix, we do recommend to look for the Radeon HD 7970 Matrix instead. |
- Extreme Overclocking | - Price | |
| We gave the Radeon R9 280X Matrix Platinum from ASUS 4 out of 5 stars. | |||
