 With the Z77 OC Formula, ASRock dares to introduce their first motherboard which has been optimized towards extreme overclocking. This board has been developed under the lead of the well known overclocker NickShih who now works at ASRock as a product manager. During the past months NickShih has already proven that this board si very capable for extreme overclocking, setting several records.
 Article in English
 |
 Artikel in Deutsch
 |
 Article
en français Article
en français |
 Articolo
in italiano Articolo
in italiano |

The OC Formula is ASRock's high end overclocking motherboard regarding Intels latest Z77 chipset. Therefore we're really curious what they've come up with from the layout and design as well as feature perspective.
Discuss this article in the forums
[pagebreak]
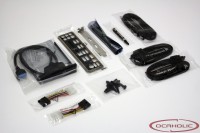
Specs and Delivery
| CPU | Intel Socket 1155 3rd/2nd Generation Core i7/i5/i3/Pentium/Celeron (22/32nm) |
| Chipset | Intel Z77 Express |
| Memory | Dual Channel 4 x DIMM, max. 32GB, DDR3 3000+(OC)/2800(OC)/2666(OC)/2400(OC)/2133(OC)/1866(OC)/1600/1333/1066 non-ECC, un-buffered memory, XMP 1.3 |
| Multi-GPU | NVIDIA 3-Way SLI AMD 3-Way CrossFireX LucidLogix Virtu MVP Technology |
| Slots | 2 x PCI-Express 3.0 x16 (PCIE2/PCIE4: single at x16 (PCIE2) / x8 (PCIE4) or dual at x8/x8 mode) 1 x PCI Express 2.0 x16 slot (PCIE5: x4 mode) 2 x PCI Express 2.0 x1 slots |
| Audio | Supreme FX Audio Codec |
| Storage | 2 x SATA 6.0 Gbps (Intel) 4 x SATA 6.0 Gbps (Marvell SE9172) |
| Bluetooth | Bluetooth v4.0 |
| Wireless | Wi-Fi 802.11 a/b/g/n |
| LAN | 1 x Gigabit LAN Broadcom BCM57781 |
| I/O internal | |
| I/O Back Panel | |
| Forfactor | Extended-ATX (30.5cm x 26.7cm) |


Discuss this article in the forums[pagebreak]
Features
| 12 + 4 Phase Power Design | Since quite some time ASRock has been equipping its boards with digital power designs. With the OC Formula they are very proud about their quite complex solution which consists of Dual-Stack MOSFET's (DSM), three different filter caps (DIP solid caps, POSCAP's and MLCC's), as well as high quality alloy chokes. |
|
| Gelid Solutions GC-Extreme Thermal Compound | Since this product mainly aims at extreme overclockers, NickShih tought about something quite special. He decided to bundle the board with Gelid's GC-Extreme thermal compound, since this is the best thermal grease you can get for extreme overclocking. | |
| NickShih's OC Profile | Unexperienced overclockers might be familiar with the circumstance, that it can take ages until you've found rock solid and stable settings you make you CPU run at a much higher frequency. At this point NickShih prepared five different profiles where the perfect settings are going to be loaded instantly and you don't need to carry anymore. Therefore it's piece of cake to clock your CPU to very high frequencies. | |
| Rapid OC | What you get with this feature are two buttons, which have been placed on the motherboard directly. Their purpose is to make overclocking even easier. In fact you can change the multiplyer, BCLK as well as VCore by simply pressing the plus or minus button |
|
| Formula Drive | Standard these days is a nice and decent software for widows, using which, one can adjust different settings related to the board from within the operating system. In case of the OC Formula you can control the fans attached to the board, overclock your CPU, use OC DNA, IES or XFast RAM or you can also monitor temperatures on your board by reading ou the differen thermal sensors. | |
Discuss this article in the forums
[pagebreak]
Layout
At a first glance the ASRock OC Formula leaves a very good impression with its harmonic design. The manfucaturer decided to go for a combination of black, yellow and gold, which suites nicely and in the end you get an aesthetic product. The layout itself is well thought and there is for example plenty of space around the CPU socket to install even todays largest CPU coolers. The fact that there are SATA connectors which have been angled by 90 degrees allow an easy installation of oversized graphics cards.

The ASRock OC Formula comes with a digital 12+4 phase power design. The CPU gets twelve phases and the memory gets a stable current supply from four individual phases. As we've already mentioned on the feature's page, ASRock decided to go for quite a complex power design where there are for example three different filtering stages to get smooth and highly constant voltages. Especially when it comes to extreme overclocking, the power design can be what tipped the scales in the end.

Totally you'll find four DIMM-slots on the OC Formula. Officially supported are DDR3 3000+(OC) / 2800(OC) / 2666(OC) / 2400(OC) / 2133(OC) / 1866(OC) / 1600 / 1333 / 1066 MHz. There is engough space between the DIMM-slots and the CPU socket which means that you wont encounter compatibility problems with big coolers even when you choose to install RAM with big heatspreaders. Also supported are Xtreme Memory Profiles (XMP) in version 1.3.

On the OC Formula the southbridge as well as current converters got separate cooling blocks. In case of the southbridge there is a single block made from aluminium, which provides appropriate cooling. A closer look at the current converters shows that there are two individual blocks connected to one another by a watercooling channel. Furthermore ASRock decided to equip the power design coolers with a 40 millimeter fan. For extreme overclockers this is a nice addition, but if you should decide to put this board into a case and you expect low operating noise, then you'll be disappointed after at last half a year. Those small fans quite quickly show issues related to the bearing and they are also very sensitive to dust. In case of putting this board into an enclosure we recommend to unplug the fan.


Discuss this article in the forums
[pagebreak]
Connectors and I/O
Totally ASRock equipped the OC Formula with no less then ten angled SATA ports. This is enough for any office setup, gaming system or overclocking setup. You'll also find practical onboard power- and reset-buttons in the top right corner of the board. There is even a debug display. Furthermore in this area of the board there are voltage read out points as well as ASRocks Rapid-OC buttons which allow an overclocker to change the multiplyer, BLCK as well as voltages on the fly.


Totally you'll find eight fan header on the OC Formula which is more than enough, to provide a well equipped high-end or overclocking-system with fresh air. The fan headers are located around the CPU socket as spread over the motherboard.


Looking at the external connectors directly at the back-panel ASRock equipped the OC Formula with six USB 3.0/2.0 ports, four USB 2.0/1.1 ports, one gigabit ethernet port, an HDMI connector as well as an optical out and an analogue audio panel. Furtheremore you'll also find a clear CMOS button.

Discuss this article in the forums [pagebreak]
BIOS
Here are some screenshots of ASRock's Z77 OC Formula BIOS.


Discuss this article in the forums [pagebreak]
|
Article in English |
Artikel in Deutsch |
Article
en français |
Articolo in italiano |
Test setup
Hardware |
|
| Motherboard |
|
| Processor | Intel Core i7-3770K, 3.5 GHz |
| Memory | 4 Gigabyte Kingston H2O KHX2133 @ 1600 MHz CL8-8-8-24 |
| Graphic card | ASUS ENGTX 580 |
| Driver | Version 275.33 |
| Hard disk | Samsung Spinpoint F1 320 GByte |
| Power supply | bequiet! Dark Power Pro 1000Watt |
Discuss this article in the forums
[pagebreak]
3D Mark
3D Mark11
3DMark 11 is Futuremarks latest benchmark for the entire graphical subsystem. The benchmark uses DirectX 11 and it supports all recent features which can possibly generate high load on a GPU. Therefore you find tessellation, compute shader calculations, divers lighting effects and different depth of filed animations. Following we publish values regarding the performance preset of 3DMark 11.
Total
| 3D Mark 11 Total |
Review Rating |
Percent | |
| ASUS Sabertooth Z77 |
No Review |
6'666 | 100.03 % |
| ASUS Maximus V Extreme |
No Review |
6'665 | 100.02 % |
| ASUS P8Z77-V |
No Review |
6'664 | 100.00 % |
| Intel DZ77GA-70K |
No Review |
6'664 | 100.00 % |
| ASUS P8Z77-I Deluxe |
No Review |
6'663 | 99.98 % |
| Gigabyte Z77MX-D3H |
No Review |
6'663 | 99.98 % |
| Biostar Hi-Fi Z77X |
No Review |
6'662 | 99.97 % |
| ASUS Maximus V Gene |
No Review |
6'662 | 99.97 % |
| ASUS P8Z77-V Deluxe |
No Review |
6'660 | 99.94 % |
| ASUS P8Z77-V Pro Thunderbolt |
No Review |
6'659 | 99.92 % |
| MSI Z77 MPower |
No Review |
6'658 | 99.91 % |
| ASUS P8H77-M LE/SI |
No Review |
6'656 | 99.88 % |
| Gigabyte Z77X-UD5H |
No Review |
6'655 | 99.86 % |
| ASUS P8Z77 WS |
No Review |
6'650 | 99.79 % |
| ASRock Z77 Extreme6 |
No Review |
6'649 | 99.77 % |
| ASUS P8H77-I |
No Review |
6'639 | 99.62 % |
| ASUS Maximus V Formula |
No Review |
6'630 | 99.49 % |
| ASUS P8Z77-V Premium |
No Review |
6'588 | 98.84 % |
| ASRock Z77 OC Formula |
No Review |
6'587 | 98.84 % |
| Gigabyte Z77 G1.Sniper 3 |
No Review |
6'587 | 98.84 % |
| Biostar TZ77XE4 TOverclocker |
No Review |
6'568 | 98.56 % |
| more is better | |||
Physic
| 3D Mark 11 CPU Score |
Review Rating |
Percent | |
| ASUS P8Z77-V Deluxe |
No Review |
9'446 | 101.22 % |
| ASUS P8Z77-V |
No Review |
9'446 | 101.22 % |
| ASUS Maximus V Gene |
No Review |
9'426 | 101.01 % |
| ASUS P8Z77 WS |
No Review |
9'424 | 100.99 % |
| ASUS Maximus V Extreme |
No Review |
9'423 | 100.98 % |
| Biostar Hi-Fi Z77X |
No Review |
9'422 | 100.96 % |
| ASUS P8Z77-I Deluxe |
No Review |
9'414 | 100.88 % |
| ASUS Sabertooth Z77 |
No Review |
9'412 | 100.86 % |
| Biostar TZ77XE4 TOverclocker |
No Review |
9'396 | 100.68 % |
| ASUS P8Z77-V Premium |
No Review |
9'396 | 100.68 % |
| Gigabyte Z77MX-D3H |
No Review |
9'376 | 100.47 % |
| ASUS P8Z77-V Pro Thunderbolt |
No Review |
9'368 | 100.39 % |
| Gigabyte Z77 G1.Sniper 3 |
No Review |
9'354 | 100.24 % |
| ASUS P8H77-M LE/SI |
No Review |
9'347 | 100.16 % |
| Intel DZ77GA-70K |
No Review |
9'332 | 100.00 % |
| Gigabyte Z77X-UD5H |
No Review |
9'324 | 99.91 % |
| MSI Z77 MPower |
No Review |
9'287 | 99.52 % |
| ASUS Maximus V Formula |
No Review |
9'259 | 99.22 % |
| ASRock Z77 OC Formula |
No Review |
9'252 | 99.14 % |
| ASRock Z77 Extreme6 |
No Review |
9'246 | 99.08 % |
| ASUS P8H77-I |
No Review |
9'081 | 97.31 % |
| more is better | |||
Discuss this article in the forums [pagebreak]
3D Mark Vantage
3DMark Vantage is able to squeeze a lot out of a recent system. Therefore the feature liste is also pretty long: DirectX10, FP16-HDR, motion blur, parallax occlusion mapping, GPU-physics simulation and different shader effects are being used to even make recent high-end systems struggle.
Total
| 3D Mark Vantage Total |
Review Rating |
Percent | |
| ASUS Maximus V Gene |
No Review |
26'270 | 100.81 % |
| Gigabyte Z77X-UD5H |
No Review |
26'255 | 100.76 % |
| Gigabyte Z77MX-D3H |
No Review |
26'254 | 100.75 % |
| ASUS P8Z77-I Deluxe |
No Review |
26'229 | 100.66 % |
| ASUS Maximus V Extreme |
No Review |
26'171 | 100.43 % |
| ASRock Z77 Extreme6 |
No Review |
26'136 | 100.30 % |
| ASUS Sabertooth Z77 |
No Review |
26'123 | 100.25 % |
| Biostar Hi-Fi Z77X |
No Review |
26'100 | 100.16 % |
| ASUS P8Z77-V |
No Review |
26'088 | 100.12 % |
| ASUS P8Z77-V Pro Thunderbolt |
No Review |
26'080 | 100.08 % |
| ASUS P8Z77-V Deluxe |
No Review |
26'084 | 100.10 % |
| ASUS P8Z77 WS |
No Review |
26'062 | 100.01 % |
| ASRock Z77 OC Formula |
No Review |
26'061 | 100.01 % |
| ASUS P8H77-M LE/SI |
No Review |
26'059 | 100.00 % |
| Intel DZ77GA-70K |
No Review |
26'058 | 100.00 % |
| ASUS P8Z77-V Premium |
No Review |
26'041 | 99.93 % |
| ASUS P8H77-I |
No Review |
25'994 | 99.75 % |
| MSI Z77 MPower |
No Review |
25'971 | 99.67 % |
| Gigabyte Z77 G1.Sniper 3 |
No Review |
25'929 | 99.50 % |
| ASUS Maximus V Formula |
No Review |
25'721 | 98.70 % |
| Biostar TZ77XE4 TOverclocker |
No Review |
25'633 | 98.37 % |
| more is better | |||
CPU
| 3D Mark Vantage CPU |
Review Rating |
Percent | |
| ASUS P8Z77-V Premium |
No Review |
25'525 | 101.66 % |
| ASUS Maximus V Formula |
No Review |
25'424 | 101.26 % |
| ASUS P8Z77 WS |
No Review |
25'421 | 101.25 % |
| Gigabyte Z77MX-D3H |
No Review |
25'383 | 101.10 % |
| Gigabyte Z77X-UD5H |
No Review |
25'378 | 101.08 % |
| ASUS Sabertooth Z77 |
No Review |
25'354 | 100.98 % |
| ASUS P8Z77-I Deluxe |
No Review |
25'327 | 100.87 % |
| ASUS Maximus V Extreme |
No Review |
25'316 | 100.83 % |
| ASUS Maximus V Gene |
No Review |
25'300 | 100.76 % |
| ASUS P8Z77-V Deluxe |
No Review |
25'290 | 100.72 % |
| Biostar Hi-Fi Z77X |
No Review |
25'283 | 100.70 % |
| ASUS P8Z77-V |
No Review |
25'255 | 100.59 % |
| Biostar TZ77XE4 TOverclocker |
No Review |
25'168 | 100.24 % |
| Intel DZ77GA-70K |
No Review |
25'108 | 100.00 % |
| ASUS P8H77-I |
No Review |
25'100 | 99.97 % |
| ASRock Z77 Extreme6 |
No Review |
25'067 | 99.84 % |
| ASUS P8H77-M LE/SI |
No Review |
25'054 | 99.78 % |
| Gigabyte Z77 G1.Sniper 3 |
No Review |
25'034 | 99.71 % |
| ASUS P8Z77-V Pro Thunderbolt |
No Review |
24'998 | 99.56 % |
| ASRock Z77 OC Formula |
No Review |
24'974 | 99.47 % |
| MSI Z77 MPower |
No Review |
24'849 | 98.97 % |
| more is better | |||
Discuss this article in the forums
[pagebreak]
3D Mark 2001
| 3D Mark 2001 |
Review Rating |
Percent | |
| ASRock Z77 OC Formula |
No Review |
61'802 | 102.63 % |
| ASUS Maximus V Extreme |
No Review |
61'642 | 102.37 % |
| ASUS Maximus V Gene |
No Review |
61'335 | 101.86 % |
| MSI Z77 MPower |
No Review |
61'044 | 101.38 % |
| ASRock Z77 Extreme6 |
No Review |
60'998 | 101.30 % |
| ASUS Sabertooth Z77 |
No Review |
60'947 | 101.21 % |
| ASUS P8Z77 WS |
No Review |
60'808 | 100.98 % |
| Biostar Hi-Fi Z77X |
No Review |
60'733 | 100.86 % |
| ASUS P8Z77-V Pro Thunderbolt |
No Review |
60'686 | 100.78 % |
| ASUS P8Z77-I Deluxe |
No Review |
60'607 | 100.65 % |
| ASUS Maximus V Formula |
No Review |
60'451 | 100.39 % |
| Biostar TZ77XE4 TOverclocker |
No Review |
60'360 | 100.24 % |
| ASUS P8Z77-V |
No Review |
60'359 | 100.24 % |
| Intel DZ77GA-70K |
No Review |
60'216 | 100.00 % |
| ASUS P8Z77-V Premium |
No Review |
60'055 | 99.73 % |
| Gigabyte Z77MX-D3H |
No Review |
60'026 | 99.68 % |
| ASUS P8H77-I |
No Review |
59'875 | 99.43 % |
| ASUS P8H77-M LE/SI |
No Review |
59'762 | 99.25 % |
| ASUS P8Z77-V Deluxe |
No Review |
59'743 | 99.21 % |
| Gigabyte Z77 G1.Sniper 3 |
No Review |
59'623 | 99.02 % |
| Gigabyte Z77X-UD5H |
No Review |
59'255 | 98.40 % |
| more is better | |||
Discuss this article in the forums [pagebreak]
PC Mark 07
PC Mark 07 is a benchmark which offers realworld scenarios and it's obvious that therefore the tests used find its origin in real world application. We decided to show you the total score as well as a selection of other scores. Like this you can quickly get a broad overview regarding a systems performance.
Total
| PC Mark 07 Total |
Review Rating |
Percent | |
| Intel DZ77GA-70K |
No Review |
5'336 | 100.00 % |
| Gigabyte Z77 G1.Sniper 3 |
No Review |
5'328 | 99.85 % |
| ASUS Maximus V Gene |
No Review |
5'322 | 99.74 % |
| ASUS Maximus V Extreme |
No Review |
5'320 | 99.70 % |
| ASUS P8Z77-I Deluxe |
No Review |
5'318 | 99.66 % |
| Gigabyte Z77MX-D3H |
No Review |
5'318 | 99.66 % |
| MSI Z77 MPower |
No Review |
5'314 | 99.59 % |
| Biostar Hi-Fi Z77X |
No Review |
5'305 | 99.42 % |
| ASUS P8Z77 WS |
No Review |
5'257 | 98.52 % |
| Gigabyte Z77X-UD5H |
No Review |
5'251 | 98.41 % |
| ASUS P8Z77-V Deluxe |
No Review |
5'241 | 98.21 % |
| ASRock Z77 Extreme6 |
No Review |
5'240 | 98.20 % |
| ASUS P8Z77-V |
No Review |
5'235 | 98.11 % |
| ASUS P8Z77-V Pro Thunderbolt |
No Review |
5'231 | 98.03 % |
| Biostar TZ77XE4 TOverclocker |
No Review |
5'223 | 97.88 % |
| ASUS P8H77-M LE/SI |
No Review |
5'209 | 97.62 % |
| ASUS Sabertooth Z77 |
No Review |
5'208 | 97.60 % |
| ASUS P8H77-I |
No Review |
5'201 | 97.47 % |
| ASRock Z77 OC Formula |
No Review |
5'144 | 96.40 % |
| ASUS Maximus V Formula |
No Review |
5'122 | 95.99 % |
| ASUS P8Z77-V Premium |
No Review |
5'076 | 95.13 % |
| more is better | |||
| Video playback and transcoding / Video playback |
Review Rating |
fps | Percent |
| ASUS P8Z77-V Premium |
No Review |
23.16 | 100.13 % |
| ASRock Z77 OC Formula |
No Review |
23.14 | 100.04 % |
| ASUS P8Z77-V Pro Thunderbolt |
No Review |
23.14 | 100.04 % |
| ASUS Maximus V Extreme |
No Review |
23.14 | 100.04 % |
| ASUS Maximus V Formula |
No Review |
23.13 | 100.00 % |
| ASUS P8Z77 WS |
No Review |
23.13 | 100.00 % |
| Intel DZ77GA-70K |
No Review |
23.13 | 100.00 % |
| Biostar Hi-Fi Z77X |
No Review |
23.12 | 99.57 % |
| ASRock Z77 Extreme6 |
No Review |
23.12 | 99.57 % |
| ASUS P8Z77-V |
No Review |
23.12 | 99.57 % |
| MSI Z77 MPower |
No Review |
23.11 | 99.91 % |
| ASUS Maximus V Gene |
No Review |
23.11 | 99.91 % |
| Biostar TZ77XE4 TOverclocker |
No Review |
23.11 | 99.91 % |
| Gigabyte Z77X-UD5H |
No Review |
23.11 | 99.91 % |
| Gigabyte Z77MX-D3H |
No Review |
23.11 | 99.91 % |
| Gigabyte Z77 G1.Sniper 3 |
No Review |
23.10 | 99.87 % |
| ASUS Sabertooth Z77 |
No Review |
23.10 | 99.87 % |
| ASUS P8Z77-V Deluxe |
No Review |
23.10 | 99.87 % |
| ASUS P8Z77-I Deluxe |
No Review |
23.10 | 99.87 % |
| ASUS P8H77-M LE/SI |
No Review |
23.10 | 99.87 % |
| ASUS P8H77-I |
No Review |
23.10 | 99.87 % |
| more is better | |||
| Graphics - DirectX 9 / Graphics - DirectX 9 |
Review Rating |
fps | Percent |
| ASRock Z77 Extreme6 |
No Review |
90.71 | 101.45 % |
| ASUS P8Z77-I Deluxe |
No Review |
90.50 | 101.22 % |
| Gigabyte Z77MX-D3H |
No Review |
90.39 | 101.10 % |
| Gigabyte Z77 G1.Sniper 3 |
No Review |
90.32 | 101.02 % |
| MSI Z77 MPower |
No Review |
90.26 | 100.95 % |
| Biostar Hi-Fi Z77X |
No Review |
90.22 | 100.91 % |
| ASUS Maximus V Extreme |
No Review |
90.17 | 100.85 % |
| ASUS P8Z77 WS |
No Review |
90.15 | 100.83 % |
| ASUS Sabertooth Z77 |
No Review |
90.11 | 100.78 % |
| ASUS P8Z77-V Pro Thunderbolt |
No Review |
90.09 | 100.76 % |
| ASUS Maximus V Gene |
No Review |
90.09 | 100.76 % |
| ASUS P8Z77-V Premium |
No Review |
90.01 | 100.67 % |
| Gigabyte Z77X-UD5H |
No Review |
89.93 | 100.58 % |
| ASUS Maximus V Formula |
No Review |
89.83 | 100.47 % |
| Biostar TZ77XE4 TOverclocker |
No Review |
89.59 | 100.20 % |
| ASRock Z77 OC Formula |
No Review |
89.46 | 100.06 % |
| Intel DZ77GA-70K |
No Review |
89.41 | 100.00 % |
| ASUS P8Z77-V |
No Review |
89.30 | 99.88 % |
| ASUS P8Z77-V Deluxe |
No Review |
88.77 | 99.28 % |
| ASUS P8H77-M LE/SI |
No Review |
88.43 | 98.90 % |
| ASUS P8H77-I |
No Review |
88.29 | 98.75 % |
| more is better | |||
| Image manipulation / Image manipulation |
Review Rating |
Mpx/s | Percent |
| ASUS P8Z77 WS |
No Review |
11.88 | 100.93 % |
| ASUS Maximus V Extreme |
No Review |
11.87 | 100.85 % |
| Biostar Hi-Fi Z77X |
No Review |
11.83 | 100.51 % |
| ASUS P8Z77-V |
No Review |
11.83 | 100.51 % |
| ASUS Sabertooth Z77 |
No Review |
11.83 | 100.51 % |
| ASUS P8Z77-V Deluxe |
No Review |
11.83 | 100.51 % |
| ASUS Maximus V Gene |
No Review |
11.81 | 100.34 % |
| MSI Z77 MPower |
No Review |
11.80 | 100.25 % |
| ASUS P8Z77-V Pro Thunderbolt |
No Review |
11.80 | 100.25 % |
| ASUS P8Z77-V Premium |
No Review |
11.80 | 100.25 % |
| Gigabyte Z77 G1.Sniper 3 |
No Review |
11.79 | 100.17 % |
| ASRock Z77 OC Formula |
No Review |
11.78 | 100.08 % |
| ASRock Z77 Extreme6 |
No Review |
11.78 | 100.08 % |
| Gigabyte Z77X-UD5H |
No Review |
11.78 | 100.08 % |
| ASUS Maximus V Formula |
No Review |
11.77 | 100.00 % |
| Intel DZ77GA-70K |
No Review |
11.77 | 100.00 % |
| Biostar TZ77XE4 TOverclocker |
No Review |
11.77 | 100.00 % |
| ASUS P8Z77-I Deluxe |
No Review |
11.76 | 99.92 % |
| Gigabyte Z77MX-D3H |
No Review |
11.76 | 99.92 % |
| ASUS P8H77-M LE/SI |
No Review |
11.74 | 99.75 % |
| ASUS P8H77-I |
No Review |
11.72 | 99.58 % |
| more is better | |||
| Web browsing and decrypting / Web browsing |
Review Rating |
Pages/s | Percent |
| Biostar TZ77XE4 TOverclocker |
No Review |
18.19 | 100.94 % |
| ASUS P8Z77-V Deluxe |
No Review |
18.13 | 100.61 % |
| Biostar Hi-Fi Z77X |
No Review |
18.10 | 100.44 % |
| Gigabyte Z77 G1.Sniper 3 |
No Review |
18.07 | 100.28 % |
| ASUS P8Z77-I Deluxe |
No Review |
18.04 | 100.11 % |
| MSI Z77 MPower |
No Review |
18.03 | 100.06 % |
| Gigabyte Z77X-UD5H |
No Review |
18.03 | 100.06 % |
| Intel DZ77GA-70K |
No Review |
18.02 | 100.00 % |
| ASRock Z77 OC Formula |
No Review |
17.99 | 99.83 % |
| Gigabyte Z77MX-D3H |
No Review |
17.99 | 99.83 % |
| ASRock Z77 Extreme6 |
No Review |
17.95 | 99.61 % |
| ASUS P8H77-M LE/SI |
No Review |
17.93 | 99.50 % |
| ASUS P8Z77-V |
No Review |
17.92 | 99.45 % |
| ASUS Sabertooth Z77 |
No Review |
17.91 | 99.39 % |
| ASUS P8H77-I |
No Review |
17.83 | 98.95 % |
| ASUS Maximus V Gene |
No Review |
17.74 | 98.45 % |
| ASUS Maximus V Extreme |
No Review |
17.39 | 96.50 % |
| ASUS P8Z77-V Pro Thunderbolt |
No Review |
17.27 | 95.84 % |
| ASUS Maximus V Formula |
No Review |
17.09 | 94.94 % |
| ASUS P8Z77 WS |
No Review |
17.60 | 97.67 % |
| ASUS P8Z77-V Premium |
No Review |
16.44 | 91.23 % |
| more is better | |||
Discuss this article in the forums
[pagebreak]
SiSoft Sandra 1
SiSoft Sandra is a theoretical multi purpose benchmark suite which is able to show differences in CPU architectures. We split the tests with SiSoft Sandra into two parts. Therefore on this page you'll find Arithmetic-, Multimedia- and Cryptograph99y-benchmarks.
Arithmetic Benchmark
| SiSoft Sandra - Arithmetic Benchmark - Dhrystone |
Review Rating |
GIPS | Percent |
| ASUS P8Z77-V |
No Review |
116.00 | 101.05 % |
| ASUS Sabertooth Z77 |
No Review |
116.00 | 101.05 % |
| ASUS P8Z77-V Deluxe |
No Review |
115.77 | 100.85 % |
| ASUS P8Z77-V Pro Thunderbolt |
No Review |
115.75 | 100.84 % |
| ASRock Z77 Extreme6 |
No Review |
115.61 | 100.71 % |
| ASUS Maximus V Extreme |
No Review |
115.58 | 100.69 % |
| ASUS Maximus V Gene |
No Review |
115.50 | 100.62 % |
| ASUS P8H77-I |
No Review |
115.42 | 100.55 % |
| ASRock Z77 OC Formula |
No Review |
115.41 | 100.54 % |
| ASUS P8Z77 WS |
No Review |
115.32 | 100.46 % |
| ASUS P8H77-M LE/SI |
No Review |
115.30 | 100.44 % |
| ASUS P8Z77-I Deluxe |
No Review |
115.26 | 100.41 % |
| Gigabyte Z77X-UD5H |
No Review |
115.24 | 100.39 % |
| Gigabyte Z77 G1.Sniper 3 |
No Review |
115.22 | 100.37 % |
| ASUS Maximus V Formula |
No Review |
115.12 | 100.29 % |
| Biostar Hi-Fi Z77X |
No Review |
115.11 | 100.28 % |
| Biostar TZ77XE4 TOverclocker |
No Review |
115.00 | 100.18 % |
| MSI Z77 MPower |
No Review |
114.97 | 100.16 % |
| Intel DZ77GA-70K |
No Review |
114.79 | 100.00 % |
| ASUS P8Z77-V Premium |
No Review |
114.63 | 99.86 % |
| Gigabyte Z77MX-D3H |
No Review |
114.37 | 99.63 % |
| more is better | |||
| SiSoft Sandra - Arithmetic Benchmark - Whetstone |
Review Rating |
GFLOPS | Percent |
| ASUS Sabertooth Z77 |
No Review |
88.89 | 100.49 % |
| ASUS P8Z77 WS |
No Review |
88.82 | 100.41 % |
| ASUS P8Z77-V |
No Review |
88.78 | 100.36 % |
| ASUS P8Z77-V Pro Thunderbolt |
No Review |
88.67 | 100.24 % |
| ASUS Maximus V Formula |
No Review |
88.64 | 100.20 % |
| ASUS Maximus V Gene |
No Review |
88.62 | 100.18 % |
| Gigabyte Z77 G1.Sniper 3 |
No Review |
88.52 | 100.07 % |
| ASUS P8H77-I |
No Review |
88.50 | 100.05 % |
| Gigabyte Z77MX-D3H |
No Review |
88.47 | 100.01 % |
| ASRock Z77 OC Formula |
No Review |
88.47 | 100.01 % |
| Intel DZ77GA-70K |
No Review |
88.46 | 100.00 % |
| ASUS P8Z77-V Premium |
No Review |
88.44 | 99.97 % |
| Biostar Hi-Fi Z77X |
No Review |
88.28 | 99.80 % |
| MSI Z77 MPower |
No Review |
88.24 | 99.75 % |
| ASUS Maximus V Extreme |
No Review |
88.22 | 99.73 % |
| Biostar TZ77XE4 TOverclocker |
No Review |
88.22 | 99.73 % |
| ASUS P8H77-M LE/SI |
No Review |
88.18 | 99.68 % |
| ASRock Z77 Extreme6 |
No Review |
88.00 | 99.48 % |
| ASUS P8Z77-I Deluxe |
No Review |
88.00 | 99.48 % |
| Gigabyte Z77X-UD5H |
No Review |
87.82 | 99.28 % |
| ASUS P8Z77-V Deluxe |
No Review |
87.80 | 99.25 % |
| more is better | |||
Multimedia
| SiSoft Sandra - Multimedia - Integer |
Review Rating |
MPixels/sec | Percent |
| ASUS P8Z77-V Deluxe |
No Review |
212.26 | 100.91 % |
| ASUS Maximus V Extreme |
No Review |
212.24 | 100.90 % |
| ASUS Sabertooth Z77 |
No Review |
212.09 | 100.83 % |
| ASUS P8Z77-V |
No Review |
212.00 | 100.78 % |
| ASRock Z77 Extreme6 |
No Review |
211.62 | 100.60 % |
| ASUS P8Z77-V Pro Thunderbolt |
No Review |
211.52 | 100.56 % |
| ASUS Maximus V Formula |
No Review |
211.46 | 100.53 % |
| ASUS P8Z77 WS |
No Review |
211.39 | 100.49 % |
| ASUS Maximus V Gene |
No Review |
211.29 | 100.45 % |
| Gigabyte Z77 G1.Sniper 3 |
No Review |
211.27 | 100.44 % |
| Gigabyte Z77X-UD5H |
No Review |
211.13 | 100.37 % |
| MSI Z77 MPower |
No Review |
211.04 | 100.33 % |
| Biostar Hi-Fi Z77X |
No Review |
211.04 | 100.33 % |
| ASUS P8H77-I |
No Review |
211.00 | 100.31 % |
| Gigabyte Z77MX-D3H |
No Review |
210.88 | 100.25 % |
| ASUS P8H77-M LE/SI |
No Review |
210.74 | 100.19 % |
| ASRock Z77 OC Formula |
No Review |
210.63 | 100.13 % |
| ASUS P8Z77-I Deluxe |
No Review |
210.63 | 100.13 % |
| ASUS P8Z77-V Premium |
No Review |
210.51 | 100.07 % |
| Biostar TZ77XE4 TOverclocker |
No Review |
210.38 | 100.01 % |
| Intel DZ77GA-70K |
No Review |
210.35 | 100.00 % |
| more is better | |||
| SiSoft Sandra - Multimedia - Floating Point |
Review Rating |
MPixels/sec | Percent |
| ASUS Sabertooth Z77 |
No Review |
297.67 | 100.95 % |
| ASUS Maximus V Extreme |
No Review |
297.63 | 100.94 % |
| ASUS P8Z77-V |
No Review |
297.10 | 100.76 % |
| ASUS Maximus V Gene |
No Review |
297.10 | 100.76 % |
| ASUS P8Z77-V Deluxe |
No Review |
296.85 | 100.67 % |
| ASRock Z77 Extreme6 |
No Review |
296.59 | 100.58 % |
| ASUS Maximus V Formula |
No Review |
296.30 | 100.48 % |
| Gigabyte Z77 G1.Sniper 3 |
No Review |
296.14 | 100.43 % |
| Biostar Hi-Fi Z77X |
No Review |
296.09 | 100.41 % |
| ASUS P8H77-M LE/SI |
No Review |
296.00 | 100.38 % |
| ASUS P8Z77-I Deluxe |
No Review |
295.88 | 100.34 % |
| MSI Z77 MPower |
No Review |
295.87 | 100.34 % |
| ASUS P8Z77-V Premium |
No Review |
295.74 | 100.29 % |
| ASUS P8H77-I |
No Review |
295.50 | 100.21 % |
| Biostar TZ77XE4 TOverclocker |
No Review |
295.48 | 100.21 % |
| ASUS P8Z77-V Pro Thunderbolt |
No Review |
295.45 | 100.20 % |
| ASRock Z77 OC Formula |
No Review |
295.41 | 100.18 % |
| ASUS P8Z77 WS |
No Review |
295.23 | 100.12 % |
| Gigabyte Z77X-UD5H |
No Review |
294.90 | 100.01 % |
| Intel DZ77GA-70K |
No Review |
294.87 | 100.00 % |
| Gigabyte Z77MX-D3H |
No Review |
294.79 | 99.97 % |
| more is better | |||
Crytography
| SiSoft Sandra - Crytography - AES 256 |
Review Rating |
GB/sec | Percent |
| ASUS Maximus V Extreme |
No Review |
7.14 | 102.00 % |
| ASUS P8Z77-V Deluxe |
No Review |
7.12 | 101.71 % |
| ASUS P8Z77-V |
No Review |
7.11 | 101.57 % |
| ASUS Maximus V Gene |
No Review |
7.11 | 101.57 % |
| ASUS P8Z77 WS |
No Review |
7.09 | 101.29 % |
| ASUS P8Z77-I Deluxe |
No Review |
7.08 | 101.14 % |
| Biostar Hi-Fi Z77X |
No Review |
7.07 | 101.00 % |
| ASUS Sabertooth Z77 |
No Review |
7.07 | 101.00 % |
| MSI Z77 MPower |
No Review |
7.05 | 100.71 % |
| ASUS P8Z77-V Pro Thunderbolt |
No Review |
7.04 | 100.57 % |
| ASRock Z77 OC Formula |
No Review |
7.01 | 100.14 % |
| ASUS P8H77-M LE/SI |
No Review |
7.00 | 100.00 % |
| ASUS P8Z77-V Premium |
No Review |
7.00 | 100.00 % |
| Gigabyte Z77 G1.Sniper 3 |
No Review |
7.00 | 100.00 % |
| ASRock Z77 Extreme6 |
No Review |
7.00 | 100.00 % |
| Intel DZ77GA-70K |
No Review |
7.00 | 100.00 % |
| Biostar TZ77XE4 TOverclocker |
No Review |
7.00 | 100.00 % |
| Gigabyte Z77X-UD5H |
No Review |
7.00 | 100.00 % |
| Gigabyte Z77MX-D3H |
No Review |
7.00 | 100.00 % |
| ASUS Maximus V Formula |
No Review |
6.91 | 98.71 % |
| ASUS P8H77-I |
No Review |
6.20 | 88.57 % |
| more is better | |||
| SiSoft Sandra - Crytography - SHA 256 |
Review Rating |
MB/sec | Percent |
| ASUS Maximus V Extreme |
No Review |
1.21 | 100.83 % |
| ASUS P8Z77 WS |
No Review |
1.21 | 100.83 % |
| ASUS Sabertooth Z77 |
No Review |
1.21 | 100.83 % |
| MSI Z77 MPower |
No Review |
1.20 | 100.00 % |
| ASUS P8Z77-V Pro Thunderbolt |
No Review |
1.20 | 100.00 % |
| ASRock Z77 OC Formula |
No Review |
1.20 | 100.00 % |
| Biostar Hi-Fi Z77X |
No Review |
1.20 | 100.00 % |
| ASUS Maximus V Formula |
No Review |
1.20 | 100.00 % |
| ASUS P8H77-M LE/SI |
No Review |
1.20 | 100.00 % |
| Gigabyte Z77 G1.Sniper 3 |
No Review |
1.20 | 100.00 % |
| ASUS P8Z77-V Premium |
No Review |
1.20 | 100.00 % |
| ASRock Z77 Extreme6 |
No Review |
1.20 | 100.00 % |
| ASUS P8Z77-V |
No Review |
1.20 | 100.00 % |
| ASUS Maximus V Gene |
No Review |
1.20 | 100.00 % |
| ASUS P8H77-I |
No Review |
1.20 | 100.00 % |
| ASUS P8Z77-V Deluxe |
No Review |
1.20 | 100.00 % |
| ASUS P8Z77-I Deluxe |
No Review |
1.20 | 100.00 % |
| Intel DZ77GA-70K |
No Review |
1.20 | 100.00 % |
| Biostar TZ77XE4 TOverclocker |
No Review |
1.20 | 100.00 % |
| Gigabyte Z77X-UD5H |
No Review |
1.20 | 100.00 % |
| Gigabyte Z77MX-D3H |
No Review |
1.20 | 100.00 % |
| more is better | |||
Discuss this article in the forums
[pagebreak]
SiSoft Sandra 2
At this point we deliver the values regarding Memory Bandwidth, Memory Latency as well as Memory and Cache Access.
Memory bandwidth
| SiSoft Sandra - Memory bandwidth - Integer |
Review Rating |
GB/sec | Percent |
| ASUS P8Z77-V Deluxe |
No Review |
22.07 | 101.01 % |
| ASUS Maximus V Extreme |
No Review |
22.02 | 100.78 % |
| ASUS P8Z77 WS |
No Review |
22.00 | 100.69 % |
| ASUS P8Z77-V |
No Review |
22.00 | 100.69 % |
| ASUS Sabertooth Z77 |
No Review |
22.00 | 100.69 % |
| ASUS Maximus V Gene |
No Review |
22.00 | 100.69 % |
| ASUS P8Z77-V Pro Thunderbolt |
No Review |
21.92 | 100.32 % |
| ASUS P8Z77-I Deluxe |
No Review |
21.92 | 100.32 % |
| Biostar Hi-Fi Z77X |
No Review |
21.89 | 100.18 % |
| MSI Z77 MPower |
No Review |
21.88 | 100.14 % |
| ASUS P8H77-M LE/SI |
No Review |
21.87 | 100.09 % |
| Intel DZ77GA-70K |
No Review |
21.85 | 100.00 % |
| Gigabyte Z77X-UD5H |
No Review |
21.83 | 99.91 % |
| ASRock Z77 Extreme6 |
No Review |
21.82 | 99.86 % |
| Gigabyte Z77 G1.Sniper 3 |
No Review |
21.81 | 99.82 % |
| Biostar TZ77XE4 TOverclocker |
No Review |
21.78 | 99.68 % |
| Gigabyte Z77MX-D3H |
No Review |
21.76 | 99.59 % |
| ASUS P8Z77-V Premium |
No Review |
21.75 | 99.54 % |
| ASRock Z77 OC Formula |
No Review |
21.43 | 98.08 % |
| ASUS Maximus V Formula |
No Review |
21.33 | 97.62 % |
| ASUS P8H77-I |
No Review |
19.20 | 87.87 % |
| more is better | |||
| SiSoft Sandra - Memory bandwidth - floating point |
Review Rating |
GB/sec | Percent |
| ASUS Maximus V Extreme |
No Review |
22.01 | 100.78 % |
| ASUS P8Z77 WS |
No Review |
22.00 | 100.73 % |
| ASUS P8Z77-V |
No Review |
22.00 | 100.73 % |
| ASUS Maximus V Gene |
No Review |
22.00 | 100.73 % |
| ASUS Sabertooth Z77 |
No Review |
22.00 | 100.73 % |
| ASUS P8Z77-V Deluxe |
No Review |
22.00 | 100.73 % |
| ASUS P8Z77-V Pro Thunderbolt |
No Review |
21.92 | 100.37 % |
| ASUS P8Z77-I Deluxe |
No Review |
21.92 | 100.37 % |
| Biostar TZ77XE4 TOverclocker |
No Review |
21.90 | 100.27 % |
| MSI Z77 MPower |
No Review |
21.88 | 100.18 % |
| Biostar Hi-Fi Z77X |
No Review |
21.88 | 100.18 % |
| ASUS P8H77-M LE/SI |
No Review |
21.87 | 100.14 % |
| Intel DZ77GA-70K |
No Review |
21.84 | 100.00 % |
| Gigabyte Z77X-UD5H |
No Review |
21.83 | 99.95 % |
| ASRock Z77 Extreme6 |
No Review |
21.82 | 99.91 % |
| Gigabyte Z77 G1.Sniper 3 |
No Review |
21.81 | 99.86 % |
| Gigabyte Z77MX-D3H |
No Review |
21.79 | 99.77 % |
| ASUS P8Z77-V Premium |
No Review |
21.73 | 99.54 % |
| ASRock Z77 OC Formula |
No Review |
21.42 | 98.08 % |
| ASUS Maximus V Formula |
No Review |
21.33 | 97.66 % |
| ASUS P8H77-I |
No Review |
19.20 | 87.91 % |
| more is better | |||
Memory latency
| SiSoft Sandra - Memory latency |
Review Rating |
ns | Percent |
| ASUS P8Z77 WS |
No Review |
21.2 | 100.94 % |
| ASUS Maximus V Extreme |
No Review |
21.3 | 100.47 % |
| ASUS P8Z77-V Premium |
No Review |
21.3 | 100.47 % |
| Intel DZ77GA-70K |
No Review |
21.4 | 100.00 % |
| Biostar TZ77XE4 TOverclocker |
No Review |
21.4 | 100.00 % |
| ASUS P8Z77-V Pro Thunderbolt |
No Review |
21.5 | 99.53 % |
| Biostar Hi-Fi Z77X |
No Review |
21.5 | 99.53 % |
| Gigabyte Z77 G1.Sniper 3 |
No Review |
21.5 | 99.53 % |
| Gigabyte Z77X-UD5H |
No Review |
21.5 | 99.53 % |
| Gigabyte Z77MX-D3H |
No Review |
22.3 | 95.96 % |
| ASUS Maximus V Formula |
No Review |
22.5 | 95.11 % |
| ASUS Sabertooth Z77 |
No Review |
23.1 | 92.64 % |
| ASUS Maximus V Gene |
No Review |
23.1 | 92.64 % |
| ASRock Z77 OC Formula |
No Review |
23.5 | 91.06 % |
| MSI Z77 MPower |
No Review |
23.5 | 91.06 % |
| ASUS P8H77-M LE/SI |
No Review |
23.9 | 89.54 % |
| ASUS P8Z77-V |
No Review |
23.9 | 89.54 % |
| ASUS P8Z77-V Deluxe |
No Review |
23.9 | 89.54 % |
| ASUS P8Z77-I Deluxe |
No Review |
23.9 | 89.54 % |
| ASRock Z77 Extreme6 |
No Review |
25.6 | 83.59 % |
| ASUS P8H77-I |
No Review |
26.0 | 82.31 % |
| less is better | more is better | ||
Memory and cache access
| SiSoft Sandra - Memory and cache access |
Review Rating |
GB/sec | Percent |
| ASUS P8Z77-V Deluxe |
No Review |
120.49 | 101.01 % |
| ASUS Sabertooth Z77 |
No Review |
120.31 | 100.86 % |
| ASUS P8Z77-V |
No Review |
120.15 | 100.73 % |
| MSI Z77 MPower |
No Review |
120.01 | 100.61 % |
| ASUS P8Z77 WS |
No Review |
119.99 | 100.60 % |
| ASUS Maximus V Extreme |
No Review |
119.88 | 100.50 % |
| ASUS P8Z77-V Pro Thunderbolt |
No Review |
119.70 | 100.35 % |
| ASUS P8H77-M LE/SI |
No Review |
119.68 | 100.34 % |
| ASUS P8Z77-I Deluxe |
No Review |
119.65 | 100.31 % |
| ASUS Maximus V Gene |
No Review |
119.56 | 100.23 % |
| Gigabyte Z77X-UD5H |
No Review |
119.39 | 100.09 % |
| ASRock Z77 Extreme6 |
No Review |
119.33 | 100.04 % |
| Intel DZ77GA-70K |
No Review |
119.28 | 100.00 % |
| Biostar TZ77XE4 TOverclocker |
No Review |
119.24 | 99.97 % |
| ASUS P8Z77-V Premium |
No Review |
119.19 | 99.92 % |
| Biostar Hi-Fi Z77X |
No Review |
118.93 | 99.71 % |
| Gigabyte Z77MX-D3H |
No Review |
118.89 | 99.67 % |
| ASUS Maximus V Formula |
No Review |
118.86 | 99.65 % |
| Gigabyte Z77 G1.Sniper 3 |
No Review |
118.52 | 99.36 % |
| ASRock Z77 OC Formula |
No Review |
118.39 | 99.25 % |
| ASUS P8H77-I |
No Review |
114.40 | 95.91 % |
| more is better | |||
Discuss this article in the forums
[pagebreak]
UC Bench
| UC Bench |
Review Rating |
PW/sec | Percent |
| ASUS Maximus V Gene |
No Review |
889.9 | 100.74 % |
| ASUS P8Z77-V |
No Review |
889.7 | 100.71 % |
| ASUS P8Z77-V Deluxe |
No Review |
889.8 | 100.72 % |
| ASUS P8Z77 WS |
No Review |
889.6 | 100.70 % |
| ASUS Maximus V Extreme |
No Review |
889.2 | 100.66 % |
| ASRock Z77 Extreme6 |
No Review |
889.1 | 100.65 % |
| ASUS Maximus V Formula |
No Review |
888.5 | 100.58 % |
| ASUS P8Z77-V Premium |
No Review |
888.4 | 100.56 % |
| Biostar Hi-Fi Z77X |
No Review |
888.0 | 100.52 % |
| ASUS Sabertooth Z77 |
No Review |
887.9 | 100.51 % |
| ASUS P8Z77-V Pro Thunderbolt |
No Review |
886.9 | 100.40 % |
| Gigabyte Z77X-UD5H |
No Review |
885.0 | 100.18 % |
| ASUS P8H77-I |
No Review |
885.0 | 100.18 % |
| Gigabyte Z77 G1.Sniper 3 |
No Review |
884.8 | 100.16 % |
| ASUS P8Z77-I Deluxe |
No Review |
884.8 | 100.16 % |
| Gigabyte Z77MX-D3H |
No Review |
884.8 | 100.16 % |
| ASRock Z77 OC Formula |
No Review |
884.6 | 100.14 % |
| MSI Z77 MPower |
No Review |
883.6 | 100.02 % |
| Intel DZ77GA-70K |
No Review |
883.4 | 100.00 % |
| ASUS P8H77-M LE/SI |
No Review |
882.6 | 99.91 % |
| Biostar TZ77XE4 TOverclocker |
No Review |
882.5 | 99.90 % |
| more is better | |||
Discuss this article in the forums [pagebreak]
Super Pi 1M - 32M
Meanwhile Super Pi even in its latest version has become pretty old. Never the less it is able to show scaling to the clock speed nicely.
Super Pi 1M
| Super Pi 1.5 XS - 1M |
Review Rating |
sec | Percent |
| ASUS Maximus V Extreme |
No Review |
10.311 | 100.92 % |
| ASUS P8Z77 WS |
No Review |
10.327 | 100.76 % |
| ASUS Maximus V Gene |
No Review |
10.327 | 100.76 % |
| ASUS Sabertooth Z77 |
No Review |
10.329 | 100.75 % |
| ASUS Maximus V Formula |
No Review |
10.343 | 100.61 % |
| ASUS P8Z77-V Pro Thunderbolt |
No Review |
10.359 | 100.45 % |
| ASUS P8Z77-V |
No Review |
10.359 | 100.45 % |
| ASRock Z77 OC Formula |
No Review |
10.374 | 100.31 % |
| ASRock Z77 Extreme6 |
No Review |
10.374 | 100.31 % |
| ASUS P8Z77-V Deluxe |
No Review |
10.374 | 100.31 % |
| ASUS P8Z77-V Premium |
No Review |
10.374 | 100.31 % |
| Gigabyte Z77X-UD5H |
No Review |
10.374 | 100.31 % |
| Biostar Hi-Fi Z77X |
No Review |
10.389 | 100.16 % |
| ASUS P8Z77-I Deluxe |
No Review |
10.390 | 100.15 % |
| ASUS P8H77-I |
No Review |
10.390 | 100.15 % |
| MSI Z77 MPower |
No Review |
10.405 | 100.01 % |
| Gigabyte Z77 G1.Sniper 3 |
No Review |
10.405 | 100.01 % |
| Intel DZ77GA-70K |
No Review |
10.406 | 100.00 % |
| Gigabyte Z77MX-D3H |
No Review |
10.406 | 100.00 % |
| ASUS P8H77-M LE/SI |
No Review |
10.420 | 99.87 % |
| Biostar TZ77XE4 TOverclocker |
No Review |
10.467 | 99.42 % |
| less is better | more is better | ||
Super Pi 32M
| Super Pi 1.5 XS - 32M |
Review Rating |
sec | Percent |
| ASUS Maximus V Extreme |
No Review |
558.528 | 101.07 % |
| ASUS P8Z77 WS |
No Review |
558.887 | 101.00 % |
| ASUS Maximus V Gene |
No Review |
559.714 | 100.86 % |
| ASUS P8Z77-V Deluxe |
No Review |
559.853 | 100.83 % |
| ASUS Sabertooth Z77 |
No Review |
560.384 | 100.74 % |
| Biostar Hi-Fi Z77X |
No Review |
560.540 | 100.71 % |
| ASUS P8Z77-V |
No Review |
560.868 | 100.65 % |
| ASUS P8Z77-V Premium |
No Review |
560.961 | 100.63 % |
| Gigabyte Z77 G1.Sniper 3 |
No Review |
561.071 | 100.51 % |
| ASUS P8Z77-V Pro Thunderbolt |
No Review |
561.679 | 100.50 % |
| Gigabyte Z77X-UD5H |
No Review |
562.257 | 100.40 % |
| Biostar TZ77XE4 TOverclocker |
No Review |
562.771 | 100.31 % |
| Gigabyte Z77MX-D3H |
No Review |
562.959 | 100.27 % |
| ASUS Maximus V Formula |
No Review |
563.832 | 100.12 % |
| Intel DZ77GA-70K |
No Review |
564.503 | 100.00 % |
| ASUS P8Z77-I Deluxe |
No Review |
564.643 | 99.98 % |
| ASUS P8H77-M LE/SI |
No Review |
564.648 | 99.97 % |
| ASRock Z77 OC Formula |
No Review |
565.429 | 99.84 % |
| ASRock Z77 Extreme6 |
No Review |
566.187 | 99.70 % |
| MSI Z77 MPower |
No Review |
567.295 | 99.51 % |
| ASUS P8H77-I |
No Review |
571.429 | 98.79 % |
| less is better | more is better | ||
Discuss this article in the forums [pagebreak]
wPrime 1024M Multicore
wPrime is based on a multithreaded algorithm to calculate the square root to up to 32 billion digits. Therefore it is possible to put 100 percent load on every core or thread and to see differences between architectures.| wPrime - 1024M Multi Core |
Review Rating |
sec | Percent |
| ASUS Maximus V Extreme |
No Review |
210.026 | 100.78 % |
| ASUS Maximus V Gene |
No Review |
210.066 | 100.76 % |
| ASRock Z77 Extreme6 |
No Review |
210.100 | 100.74 % |
| ASUS P8Z77-V |
No Review |
210.212 | 100.69 % |
| ASUS P8Z77 WS |
No Review |
210.243 | 100.67 % |
| ASUS P8Z77-V Deluxe |
No Review |
210.334 | 100.63 % |
| ASUS Sabertooth Z77 |
No Review |
210.690 | 100.46 % |
| ASUS Maximus V Formula |
No Review |
210.851 | 100.38 % |
| ASUS P8H77-I |
No Review |
211.134 | 100.25 % |
| Gigabyte Z77X-UD5H |
No Review |
211.162 | 100.24 % |
| Gigabyte Z77 G1.Sniper 3 |
No Review |
211.176 | 100.23 % |
| ASUS P8Z77-V Premium |
No Review |
211.225 | 100.20 % |
| Biostar Hi-Fi Z77X |
No Review |
211.270 | 100.18 % |
| ASUS P8Z77-V Pro Thunderbolt |
No Review |
211.335 | 100.15 % |
| Gigabyte Z77MX-D3H |
No Review |
211.394 | 100.13 % |
| ASRock Z77 OC Formula |
No Review |
211.598 | 100.03 % |
| MSI Z77 MPower |
No Review |
211.644 | 100.01 % |
| Intel DZ77GA-70K |
No Review |
211.659 | 100.00 % |
| ASUS P8H77-M LE/SI |
No Review |
211.992 | 99.84 % |
| Biostar TZ77XE4 TOverclocker |
No Review |
212.099 | 99.79 % |
| ASUS P8Z77-I Deluxe |
No Review |
214.123 | 98.85 % |
| less is better | more is better | ||
Discuss this article in the forums
[pagebreak]
Games
Crysis 800 x 600, low details
Crysis is still one of the games which has very high system requirements. Therefore developer Crytek implemented Direct3D-10-API, High-Dynamic-Range-Rendering, Parallax Occlusion Mapping, Soft Shadows, Motion Blur, Depth of Field as well as Soft Particles. We test Crysis by using DirectX9 to show CPU-sacaling especially which low resolutions. If we look at the high resolutions we are able to spot that the CPUs influence compared to the graphic card becomes much less important.
| Crysis DirectX10 (800 x 600 low details) |
Review Rating |
fps | Percent |
| Biostar Hi-Fi Z77X |
No Review |
179.41 | 107.87 % |
| ASUS P8Z77-I Deluxe |
No Review |
179.14 | 107.71 % |
| ASUS P8Z77-V Pro Thunderbolt |
No Review |
174.57 | 104.71 % |
| ASUS Maximus V Extreme |
No Review |
174.05 | 104.65 % |
| ASUS P8H77-I |
No Review |
173.23 | 104.15 % |
| ASUS P8Z77 WS |
No Review |
168.11 | 101.08 % |
| Gigabyte Z77MX-D3H |
No Review |
167.32 | 100.60 % |
| Gigabyte Z77X-UD5H |
No Review |
167.05 | 100.44 % |
| ASUS P8Z77-V Premium |
No Review |
166.50 | 100.10 % |
| ASRock Z77 OC Formula |
No Review |
166.44 | 100.07 % |
| Intel DZ77GA-70K |
No Review |
166.32 | 100.00 % |
| ASUS Maximus V Gene |
No Review |
165.97 | 99.79 % |
| Gigabyte Z77 G1.Sniper 3 |
No Review |
165.66 | 99.60 % |
| ASUS P8Z77-V |
No Review |
165.00 | 99.21 % |
| MSI Z77 MPower |
No Review |
163.93 | 98.56 % |
| ASUS P8Z77-V Deluxe |
No Review |
163.91 | 98.55 % |
| ASUS Sabertooth Z77 |
No Review |
162.97 | 97.99 % |
| Biostar TZ77XE4 TOverclocker |
No Review |
162.32 | 97.59 % |
| ASUS P8H77-M LE/SI |
No Review |
162.20 | 97.52 % |
| ASUS Maximus V Formula |
No Review |
160.84 | 96.71 % |
| ASRock Z77 Extreme6 |
No Review |
160.72 | 96.63 % |
| more is better | |||
Resident Evil 800 x 600, low details
Resident Evil uses nearly every modern rendering technology: HDR, Hemisphere Lighting, Soft Shadows, Soft Particles, Field- und Motion-Blur oder auch Alpha to Coverage and static Ambient Occlusion. Furthermore Resident Evil 5 has been optimized for multicore architectures and already comes DirectX11 ready. By using the DirectX9 benchmark we can again show CPU-scaling with low resolutions and the compared to the CPU overproportional influence of the graphics card at high resolutions.
| Resident Evil DirectX10 (800 x 600 low details) |
Review Rating |
fps | Percent |
| Intel DZ77GA-70K |
No Review |
221.4 | 100.00 % |
| Gigabyte Z77 G1.Sniper 3 |
No Review |
219.5 | 99.14 % |
| MSI Z77 MPower |
No Review |
218.8 | 98.83 % |
| ASUS P8Z77-V Deluxe |
No Review |
218.7 | 98.78 % |
| ASUS Sabertooth Z77 |
No Review |
218.5 | 98.69 % |
| ASUS P8Z77-V |
No Review |
217.7 | 98.33 % |
| ASRock Z77 Extreme6 |
No Review |
215.7 | 97.43 % |
| Biostar TZ77XE4 TOverclocker |
No Review |
215.7 | 97.43 % |
| Gigabyte Z77MX-D3H |
No Review |
215.7 | 97.43 % |
| Gigabyte Z77X-UD5H |
No Review |
213.2 | 96.30 % |
| ASUS P8H77-M LE/SI |
No Review |
212.6 | 96.03 % |
| ASUS P8Z77-I Deluxe |
No Review |
211.9 | 95.71 % |
| ASUS Maximus V Gene |
No Review |
211.6 | 95.57 % |
| Biostar Hi-Fi Z77X |
No Review |
208.0 | 93.95 % |
| ASUS P8Z77 WS |
No Review |
207.7 | 93.81 % |
| ASUS Maximus V Extreme |
No Review |
207.3 | 93.63 % |
| ASUS P8H77-I |
No Review |
207.2 | 93.59 % |
| ASRock Z77 OC Formula |
No Review |
206.3 | 93.18 % |
| ASUS Maximus V Formula |
No Review |
205.3 | 92.73 % |
| ASUS P8Z77-V Pro Thunderbolt |
No Review |
203.6 | 91.96 % |
| ASUS P8Z77-V Premium |
No Review |
201.5 | 91.01 % |
| more is better | |||
Street Fighter 4 800 x 600, low details
Street Fighter 4 comes with an extra benchmark version which makes testing you system childrens play. At low resolutions the system requirements are pretty low and we can see CPU-scaling in the results. At high resolution the graphic card becomes more important and the CPUs clock speed has less influence on the fps.
| Street Fighter 4 (800 x 600 low details) |
Review Rating |
fps | Percent |
| Gigabyte Z77X-UD5H |
No Review |
832.85 | 106.43 % |
| ASUS Maximus V Extreme |
No Review |
810.15 | 103.53 % |
| ASUS P8Z77 WS |
No Review |
808.12 | 103.27 % |
| Biostar TZ77XE4 TOverclocker |
No Review |
806.81 | 103.11 % |
| MSI Z77 MPower |
No Review |
805.95 | 103.00 % |
| Gigabyte Z77 G1.Sniper 3 |
No Review |
803.92 | 102.74 % |
| ASUS P8Z77-V Deluxe |
No Review |
802.43 | 102.55 % |
| ASUS P8Z77-V |
No Review |
802.37 | 102.54 % |
| ASUS P8Z77-I Deluxe |
No Review |
801.05 | 102.37 % |
| ASUS Maximus V Gene |
No Review |
797.67 | 101.94 % |
| ASUS Sabertooth Z77 |
No Review |
795.52 | 101.66 % |
| Biostar Hi-Fi Z77X |
No Review |
794.82 | 101.57 % |
| ASUS P8H77-M LE/SI |
No Review |
789.76 | 100.93 % |
| Gigabyte Z77MX-D3H |
No Review |
783.26 | 100.10 % |
| ASUS P8Z77-V Pro Thunderbolt |
No Review |
782.74 | 100.03 % |
| Intel DZ77GA-70K |
No Review |
782.50 | 100.00 % |
| ASUS P8Z77-V Premium |
No Review |
780.81 | 99.78 % |
| ASRock Z77 Extreme6 |
No Review |
780.76 | 99.78 % |
| ASUS Maximus V Formula |
No Review |
771.96 | 98.65 % |
| ASUS P8H77-I |
No Review |
766.45 | 97.95 % |
| ASRock Z77 OC Formula |
No Review |
762.70 | 97.47 % |
| more is better | |||
Discuss this article in the forums
[pagebreak]
Power Consumption
Idle
| Idle |
Review Rating |
Watt | Percent |
| Biostar Hi-Fi Z77X |
No Review |
84 | 123.81 % |
| ASUS P8H77-I |
No Review |
84 | 123.81 % |
| ASUS Maximus V Formula |
No Review |
89 | 116.85 % |
| ASUS P8Z77-I Deluxe |
No Review |
90 | 115.56 % |
| ASUS P8Z77-V |
No Review |
93 | 111.83 % |
| ASUS P8H77-M LE/SI |
No Review |
94 | 110.64 % |
| ASRock Z77 Extreme6 |
No Review |
96 | 108.33 % |
| MSI Z77 MPower |
No Review |
97 | 107.22 % |
| Gigabyte Z77MX-D3H |
No Review |
98 | 106.12 % |
| Biostar TZ77XE4 TOverclocker |
No Review |
98 | 106.12 % |
| ASUS P8Z77-V Pro Thunderbolt |
No Review |
100 | 104.00 % |
| ASUS Sabertooth Z77 |
No Review |
100 | 104.00 % |
| ASUS P8Z77-V Deluxe |
No Review |
101 | 102.97 % |
| ASUS Maximus V Gene |
No Review |
102 | 101.96 % |
| Intel DZ77GA-70K |
No Review |
104 | 100.00 % |
| ASUS Maximus V Extreme |
No Review |
108 | 96.30 % |
| Gigabyte Z77X-UD5H |
No Review |
110 | 94.55 % |
| Gigabyte Z77 G1.Sniper 3 |
No Review |
114 | 91.23 % |
| ASRock Z77 OC Formula |
No Review |
111 | 90.09 % |
| ASUS P8Z77 WS |
No Review |
118 | 88.14 % |
| ASUS P8Z77-V Premium |
No Review |
121 | 85.95 % |
| less is better | more is better | ||
Load
| Load |
Review Rating |
Watt | Percent |
| ASUS P8H77-I |
No Review |
136 | 108.82 % |
| ASUS P8Z77-I Deluxe |
No Review |
137 | 108.03 % |
| ASRock Z77 Extreme6 |
No Review |
138 | 107.25 % |
| ASUS P8H77-M LE/SI |
No Review |
138 | 107.25 % |
| MSI Z77 MPower |
No Review |
140 | 105.71 % |
| Biostar TZ77XE4 TOverclocker |
No Review |
142 | 104.23 % |
| ASUS P8Z77-V Pro Thunderbolt |
No Review |
143 | 103.50 % |
| Biostar Hi-Fi Z77X |
No Review |
144 | 102.78 % |
| ASUS Maximus V Gene |
No Review |
144 | 102.78 % |
| ASUS P8Z77-V |
No Review |
145 | 102.07 % |
| ASUS Maximus V Formula |
No Review |
146 | 101.37 % |
| Gigabyte Z77MX-D3H |
No Review |
146 | 101.37 % |
| ASUS Sabertooth Z77 |
No Review |
147 | 100.68 % |
| Intel DZ77GA-70K |
No Review |
148 | 100.00 % |
| ASUS P8Z77-V Deluxe |
No Review |
149 | 99.33 % |
| ASUS Maximus V Extreme |
No Review |
150 | 98.67 % |
| Gigabyte Z77X-UD5H |
No Review |
151 | 98.01 % |
| Gigabyte Z77 G1.Sniper 3 |
No Review |
155 | 95.48 % |
| ASUS P8Z77 WS |
No Review |
163 | 90.80 % |
| ASUS P8Z77-V Premium |
No Review |
164 | 90.24 % |
| ASRock Z77 OC Formula |
No Review |
170 | 87.06 % |
| less is better | more is better | ||
Discuss this article in the forums
[pagebreak]
Performance Rating
| 3D and Gaming Benchmarks |
Review Rating |
Percent |
| ASUS P8Z77-I Deluxe |
No Review |
101.10 % |
| ASUS Maximus V Extreme |
No Review |
100.82 % |
| Biostar Hi-Fi Z77X |
No Review |
100.76 % |
| Gigabyte Z77X-UD5H |
No Review |
100.40 % |
| ASUS P8Z77-V |
No Review |
100.28 % |
| ASUS Maximus V Gene |
No Review |
100.21 % |
| ASUS Sabertooth Z77 |
No Review |
100.21 % |
| ASUS P8Z77 WS |
No Review |
100.15 % |
| Gigabyte Z77MX-D3H |
No Review |
100.14 % |
| ASUS P8Z77-V Deluxe |
No Review |
100.13 % |
| Intel DZ77GA-70K |
No Review |
100.00 % |
| MSI Z77 MPower |
No Review |
99.98 % |
| Gigabyte Z77 G1.Sniper 3 |
No Review |
99.97 % |
| ASUS P8Z77-V Pro Thunderbolt |
No Review |
99.67 % |
| Biostar TZ77XE4 TOverclocker |
No Review |
99.65 % |
| ASRock Z77 Extreme6 |
No Review |
99.27 % |
| ASUS P8H77-M LE/SI |
No Review |
99.19 % |
| ASUS P8Z77-V Premium |
No Review |
98.97 % |
| ASUS P8H77-I |
No Review |
98.97 % |
| ASRock Z77 OC Formula |
No Review |
98.56 % |
| ASUS Maximus V Formula |
No Review |
98.39 % |
| more is better | ||
| 2D Benchmarks |
Review Rating |
Percent |
| ASUS Maximus V Extreme |
No Review |
100.47 % |
| ASUS P8Z77 WS |
No Review |
100.40 % |
| Biostar Hi-Fi Z77X |
No Review |
100.20 % |
| Gigabyte Z77 G1.Sniper 3 |
No Review |
100.10 % |
| ASUS Maximus V Gene |
No Review |
100.01 % |
| ASUS Sabertooth Z77 |
No Review |
100.04 % |
| Intel DZ77GA-70K |
No Review |
100.00 % |
| Gigabyte Z77X-UD5H |
No Review |
99.98 % |
| ASUS P8Z77-V Pro Thunderbolt |
No Review |
99.97 % |
| Biostar TZ77XE4 TOverclocker |
No Review |
99.92 % |
| ASUS P8Z77-V |
No Review |
99.84 % |
| ASUS P8Z77-V Deluxe |
No Review |
99.82 % |
| Gigabyte Z77MX-D3H |
No Review |
99.78 % |
| MSI Z77 MPower |
No Review |
99.66 % |
| ASUS P8Z77-I Deluxe |
No Review |
99.58 % |
| ASUS P8Z77-V Premium |
No Review |
99.41 % |
| ASUS P8H77-M LE/SI |
No Review |
99.26 % |
| ASRock Z77 Extreme6 |
No Review |
99.21 % |
| ASRock Z77 OC Formula |
No Review |
99.16 % |
| ASUS Maximus V Formula |
No Review |
99.12 % |
| ASUS P8H77-I |
No Review |
96.73 % |
| more is better | ||
| Performance per Watt |
Review Rating |
Percent |
| ASUS P8H77-I |
No Review |
90.81 % |
| Biostar Hi-Fi Z77X |
No Review |
88.67 % |
| ASUS P8Z77-I Deluxe |
No Review |
89.75 % |
| ASUS Maximus V Formula |
No Review |
90.51 % |
| ASUS P8H77-M LE/SI |
No Review |
91.08 % |
| ASRock Z77 Extreme6 |
No Review |
92.07 % |
| ASUS P8Z77-V |
No Review |
93.56 % |
| MSI Z77 MPower |
No Review |
93.76 % |
| Biostar TZ77XE4 TOverclocker |
No Review |
94.88 % |
| ASUS P8Z77-V Pro Thunderbolt |
No Review |
96.21 % |
| Gigabyte Z77MX-D3H |
No Review |
96.35 % |
| ASUS Maximus V Extreme |
No Review |
97.49 % |
| ASUS Maximus V Gene |
No Review |
97.79 % |
| ASUS Sabertooth Z77 |
No Review |
97.84 % |
| ASUS P8Z77-V Deluxe |
No Review |
98.84 % |
| Intel DZ77GA-70K |
No Review |
100.00 % |
| Gigabyte Z77X-UD5H |
No Review |
104.06 % |
| Gigabyte Z77 G1.Sniper 3 |
No Review |
107.16 % |
| ASRock Z77 OC Formula |
No Review |
111.61 % |
| ASUS P8Z77-V Premium |
No Review |
112.60 % |
| ASUS P8Z77 WS |
No Review |
112.77 % |
| less is better | ||
Discuss this article in the forums [pagebreak]
Conclusion
| Allgemein | + | - | |
| The first
impression the OC Formula from ASRock leaves, makes us want more.
We like the individual design of this board, which actually isn't that
easy to achieve anymore. Since ASUS, Gigabyte, MSI and co finally found
out that people, especially in the western part of this world, prefer
simple and decent color designs, quite a lot of color combinations have
already been chosen. The OC Formula is a motherboard that really targets extreme overclockers, but nevertheless ASRock succeeded in crafting a product that is equally attractive to the guys handling LN2 or watercooling/aircooling setups. Both worlds will be able to squeeze maximum out of their systems using this board. |
-
Design - PCI-Express 3.0 Slots - 6x SATA3 (6Gbps) |
- 40 millimeter fan to cool power design | |
| Layout | + | - | |
|
Basically the ASRock OC Formula's Layout has been very well thought. Once more practical are the angled SATA connectors as well as the power- and reset-buttons. There is also a debug display which is very useful in case you should have issues with a component in your system or the board itself. Even the placement of the PCI-Express x16 is well chosen. There is a total of three of these slots between two slots there are always two empty slots. We think this is a good number of PCI Express x16 slots for a overclocking/gaming motherboard altough most gamers will never use three graphics cards in their build. But still it leaves you with plenty of options if you want to plug in other expansion cards. Overclockers will also like the voltage readouts but basically this board is more suitable for overclockers than enthusiast gamers. |
-
Angled SATA
connectors
- Power/Reset-Button onboard - Debug display - Space around the CPU socket - Voltage readouts - Watercooling - OC Buttons |
||
| Performance | + | - | |
| At this point we would have expected more from ASRocks Overclocking motherboard. A closer look at the 2D-Performance shows that this board comes in third to the bottom and in our 3D performance rating it scores second to last. There is only one benchmark where the OC Formula really excels and this is 3D Mark 01. Concerning all the other benchmarks the results are somewhere between the last spot and the center span of our comparison tables. Unfortunately the power consumption is also quite high and with a third to last and last spot ASRock doesn't convince us. | - 3Dmark2001 | - Power Consumptoion - Performances on average | |
| BIOS / Overclocking | + | - | |
| Finally the overclocking part but first let's talk about the BIOS first. The BIOS is excellent, ASRock did a great job. It is just perfect. Nick Shih's overclocking profiles seems to work well with our processor and you have a quick access to overclocking BIOS to save/load them. There are predefined memory profiles to help you chose the right subtimings for your beloved memory, you have to know which IC they are based on though. Those profiles are accompanied by a setting that lets you chose how the BIOS has to ajust subtimings - Performance or Compatibility (understand tight and loose timings). The overclocking on this motherboard is very easy and pleasant. The BIOS is very easy to configure and the motherboard worked well and did what we expected it to do. We pushed our i7 3770K to 5GHz stable under aircooling without any issues. Also memory overclocking was really easy and good. My processor can do 1'460 MHz on the memory (limitation by the IMC (Integrated Memory Controller) on the best motherboards around working a bit with BIOS settings. On the OC Formula I didn't need to work with the BIOS at all, I just set the basic settings and it worked like a charm. It was even possible to boot directly at DDR3-2800 which most of the other motherboards I had failed to do. A more detailed overclocking article on the OC Formula will be released soon. | - Best BIOS from ASRock ever - Memory Overclocking | ||
| Recommendation | + | - | |
| We strongly recommend this motherboard to overclockers. Being Extreme overclockers or "normal" overclockers you have to consider this motherboard as the OC Formula can keep up with ASUS's ROG offer. We removed a star to the rating due to the lack of efficiency of the board, hopefully it will be fixed with a future BIOS. | -
Overclocking - Enthusiasts |
||
| Rating | |||
| We give the ASRock Z77 OC Formula four out of five stars. | |||

Discuss this article in the forums
Author: m.buechel@ocaholic.ch